
Essentials of Statistics (6th Edition)
6th Edition
ISBN: 9780134685779
Author: Mario F. Triola
Publisher: PEARSON
expand_more
expand_more
format_list_bulleted
Videos
Textbook Question
Chapter 7.2, Problem 6BSC
Using Correct Distribution. In Exercises 5–8, assume that we want to construct a confidence interval. Do one of the following, as appropriate: (a) Find the critical value tα/2, (b) find the critical value zα/2 or (c) state that neither the
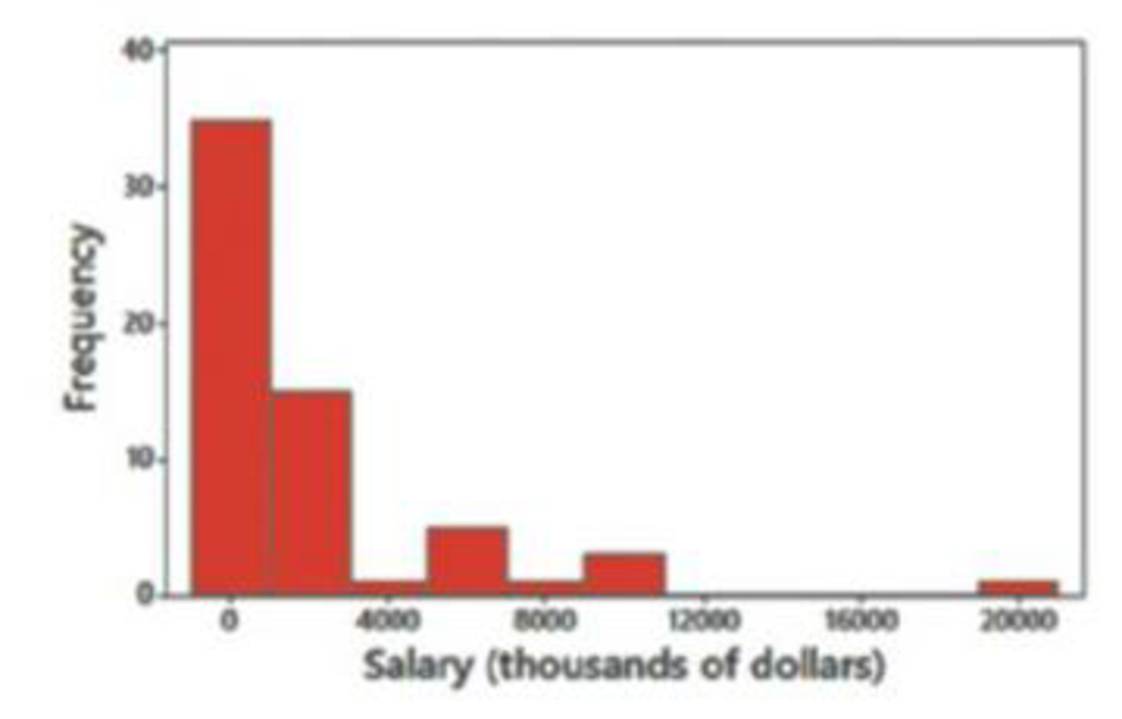
6. Denver Bronco Salaries Confidence level is 90%, σ is not known, and the histogram of 61 player salaries (thousands of dollars) is as shown.
Expert Solution & Answer

Learn your wayIncludes step-by-step video

schedule01:50
Students have asked these similar questions
Using Correct Distribution. In Exercises 5–8, assume that we want to construct a confidence interval. Do one of the following, as appropriate: (a) Find the critical value tα/2 , (b) find the critical value zα/2 , or (c) state that neither the normal distribution nor the t distribution applies.
Denver Bronco Salaries Confidence level is 99%, σ = 3342 thousand dollars, and the histogram of 61 player salaries (thousands of dollars) is shown in Exercise 6.
Using Correct Distribution. In Exercises 5–8, assume that we want to construct a confidence interval. Do one of the following, as appropriate: (a) Find the critical value tα/2 , (b) find the critical value zα/2 , or (c) state that neither the normal distribution nor the t distribution applies.
Miami Heat Salaries Confidence level is 95%, σ is not known, and the normal quantile plot of the 17 salaries (thousands of dollars) of Miami Heat basketball players is as shown.
Using Correct Distribution. In Exercises 5–8, assume that we want to construct a confidence interval. Do one of the following, as appropriate: (a) Find the critical value tα/2 , (b) find the critical value zα/2 , or (c) state that neither the normal distribution nor the t distribution applies.
Denver Bronco Salaries Confidence level is 90%, σ is not known, and the histogram of 61 player salaries (thousands of dollars) is as shown.
Chapter 7 Solutions
Essentials of Statistics (6th Edition)
Ch. 7.1 - Poll Results in the Media USA Today provided...Ch. 7.1 - Margin of Error For the poll described in Exercise...Ch. 7.1 - Notation For the poll described in Exercise 1,...Ch. 7.1 - Confidence Levels Given specific sample data, such...Ch. 7.1 - Finding Critical Values. In Exercises 58, find the...Ch. 7.1 - Finding Critical Values. In Exercises 58, find the...Ch. 7.1 - Finding Critical Values. In Exercises 58, find the...Ch. 7.1 - Finding Critical Values. In Exercises 58, find the...Ch. 7.1 - Formats of Confidence Intervals. In Exercises 912,...Ch. 7.1 - Formats of Confidence Intervals. In Exercises 912,...
Ch. 7.1 - Formats of Confidence Intervals. In Exercises 912,...Ch. 7.1 - Formats of Confidence Intervals. In Exercises 912,...Ch. 7.1 - Constructing and Interpreting Confidence...Ch. 7.1 - Constructing and Interpreting Confidence...Ch. 7.1 - Constructing and Interpreting Confidence...Ch. 7.1 - Constructing and Interpreting Confidence...Ch. 7.1 - Critical Thinking. In Exercises 1728, use the data...Ch. 7.1 - Critical Thinking. In Exercises 1728, use the data...Ch. 7.1 - Critical Thinking. In Exercises 1728, use the data...Ch. 7.1 - Critical Thinking. In Exercises 1728, use the data...Ch. 7.1 - Touch Therapy When she was 9 years of age, Emily...Ch. 7.1 - Critical Thinking. In Exercises 1728, use the data...Ch. 7.1 - Critical Thinking. In Exercises 1728, use the data...Ch. 7.1 - Critical Thinking. In Exercises 1728, use the data...Ch. 7.1 - Critical Thinking. In Exercises 1728, use the data...Ch. 7.1 - Critical Thinking. In Exercises 1728, use the data...Ch. 7.1 - Critical Thinking. In Exercises 1728, use the data...Ch. 7.1 - Critical Thinking. In Exercises 1728, use the data...Ch. 7.1 - Determining Sample Size. In Exercises 3138, use...Ch. 7.1 - Determining Sample Size. In Exercises 3138, use...Ch. 7.1 - Determining Sample Size. In Exercises 3138, use...Ch. 7.1 - Determining Sample Size. In Exercises 3138, use...Ch. 7.1 - Determining Sample Size. In Exercises 3138, use...Ch. 7.1 - Determining Sample Size. In Exercises 3138, use...Ch. 7.1 - Determining Sample Size. In Exercises 3138, use...Ch. 7.1 - Determining Sample Size. In Exercises 3138, use...Ch. 7.1 - Finite Population Correction Factor For Formulas...Ch. 7.1 - One-Sided Confidence Interval A one-sided claim...Ch. 7.1 - Coping with No Success According to the Rule of...Ch. 7.2 - In Exercises 13, refer to the accompanying screen...Ch. 7.2 - Statistical Literacy and Critical Thinking In...Ch. 7.2 - In Exercises 13, refer to the accompanying screen...Ch. 7.2 - Normality Requirement What does it mean when we...Ch. 7.2 - Using Correct Distribution. In Exercises 58,...Ch. 7.2 - Using Correct Distribution. In Exercises 58,...Ch. 7.2 - Using Correct Distribution. In Exercises 58,...Ch. 7.2 - Using Correct Distribution. In Exercises 58,...Ch. 7.2 - Confidence Intervals. In Exercises 924, construct...Ch. 7.2 - Confidence Intervals. In Exercises 924, construct...Ch. 7.2 - Confidence Intervals. In Exercises 924, construct...Ch. 7.2 - Confidence Intervals. In Exercises 924, construct...Ch. 7.2 - Confidence Intervals. In Exercises 924, construct...Ch. 7.2 - Confidence Intervals. In Exercises 924, construct...Ch. 7.2 - Confidence Intervals. In Exercises 924, construct...Ch. 7.2 - Confidence Intervals. In Exercises 924, construct...Ch. 7.2 - Confidence Intervals. In Exercises 924, construct...Ch. 7.2 - Confidence Intervals. In Exercises 924, construct...Ch. 7.2 - Confidence Intervals. In Exercises 924, construct...Ch. 7.2 - Confidence Intervals. In Exercises 924, construct...Ch. 7.2 - Confidence Intervals. In Exercises 924, construct...Ch. 7.2 - Confidence Intervals. In Exercises 924, construct...Ch. 7.2 - Confidence Intervals. In Exercises 924, construct...Ch. 7.2 - Confidence Intervals. In Exercises 924, construct...Ch. 7.2 - Sample Size. In Exercises 2936, find the sample...Ch. 7.2 - Sample Size. In Exercises 2936, find the sample...Ch. 7.2 - Sample Size. In Exercises 2936, find the sample...Ch. 7.2 - Sample Size. In Exercises 2936, find the sample...Ch. 7.2 - Sample Size. In Exercises 2936, find the sample...Ch. 7.2 - Sample Size. In Exercises 2936, find the sample...Ch. 7.2 - Sample Size. In Exercises 2936, find the sample...Ch. 7.2 - Sample Size. In Exercises 2936, find the sample...Ch. 7.2 - Confidence Interval with Known . In Exercises 37...Ch. 7.2 - Confidence Interval with Known . In Exercises 37...Ch. 7.2 - Finite Population Correction Factor If a simple...Ch. 7.3 - Brain Volume Using all of the brain volumes listed...Ch. 7.3 - Expressing Confidence Intervals Example 2 showed...Ch. 7.3 - Last Digit Analysis The dotplot below depicts the...Ch. 7.3 - Normality Requirement What is different about the...Ch. 7.3 - Finding Critical Values and Confidence Intervals....Ch. 7.3 - Finding Critical Values and Confidence Intervals....Ch. 7.3 - Finding Critical Values and Confidence Intervals....Ch. 7.3 - Finding Critical Values and Confidence Intervals....Ch. 7.3 - Finding Confidence Intervals. In Exercises 916,...Ch. 7.3 - Finding Confidence Intervals. In Exercises 916,...Ch. 7.3 - Finding Confidence Intervals. In Exercises 916,...Ch. 7.3 - Finding Confidence Intervals. In Exercises 916,...Ch. 7.3 - Finding Confidence Intervals. In Exercises 916,...Ch. 7.3 - Finding Confidence Intervals. In Exercises 916,...Ch. 7.3 - Finding Confidence Intervals. In Exercises 916,...Ch. 7.3 - Comparing Waiting Lines a. The values listed below...Ch. 7.3 - Determining Sample Size. In Exercises 1922, assume...Ch. 7.3 - Determining Sample Size. In Exercises 1922, assume...Ch. 7.3 - Determining Sample Size. In Exercises 1922, assume...Ch. 7.3 - Determining Sample Size. In Exercises 1922, assume...Ch. 7.3 - Finding Critical Values In constructing confidence...Ch. 7.3 - Finding Sample Size Instead of using Table 7-2 for...Ch. 7.4 - Replacement Why does the bootstrap method require...Ch. 7.4 - Bootstrap Sample Here is a random sample of...Ch. 7.4 - Bootstrap Sample Given the sample data from...Ch. 7.4 - Prob. 4BSCCh. 7.4 - In Exercises 58, use the relatively small number...Ch. 7.4 - In Exercises 58, use the relatively small number...Ch. 7.4 - In Exercises 58, use the relatively small number...Ch. 7.4 - In Exercises 58, use the relatively small number...Ch. 7 - Celebrities and the Law Here is a 95% confidence...Ch. 7 - Interpreting CI Write a brief statement that...Ch. 7 - Critical Value For the survey described in...Ch. 7 - Loose Change USA Today reported that 40% of people...Ch. 7 - Sample Size for Proportion Find the sample size...Ch. 7 - Sample Size for Mean Find the sample size required...Ch. 7 - Requirements A quality control analyst has...Ch. 7 - Degrees of Freedom In general, what does degrees...Ch. 7 - Critical Value Refer to Exercise 7 Requirements...Ch. 7 - Which Method? Refer to Exercise 7 Requirements and...Ch. 7 - Online News In a Harris poll of 2036 adults, 40%...Ch. 7 - Computers In order to better plan for student...Ch. 7 - Earthquake Magnitudes Listed below are Richter...Ch. 7 - Lefties There have been several studies conducted...Ch. 7 - Distributions Identify the distribution (normal,...Ch. 7 - Sample Size You have been hired by your new...Ch. 7 - Wristwatch Accuracy Students of the author...Ch. 7 - Wristwatch Accuracy Use the sample data from...Ch. 7 - Flight Arrivals. Listed below are the arrival...Ch. 7 - Flight Arrivals. Listed below are the arrival...Ch. 7 - Flight Arrivals. Listed below are the arrival...Ch. 7 - Flight Arrivals. Listed below are the arrival...Ch. 7 - Normal Distribution Using a larger data set than...Ch. 7 - Sample Size Find the sample size necessary to...Ch. 7 - Prob. 7CRECh. 7 - Normality Assessment A random sample consists of...Ch. 7 - Critical Thinking: What does the survey tell us?...Ch. 7 - Critical Thinking: What does the survey tell us?...Ch. 7 - Critical Thinking: What does the survey tell us?...Ch. 7 - Critical Thinking: What does the survey tell us?...Ch. 7 - Critical Thinking: What does the survey tell us?...
Additional Math Textbook Solutions
Find more solutions based on key concepts
2. Source of Data In conducting a statistical study, why is it important to consider the source of the data?
Elementary Statistics
For a population containing N=902 individual, what code number would you assign for a. the first person on the ...
Basic Business Statistics, Student Value Edition
16. Singers The display shows the heights of some of the singers in a chorus, collected so that the singers cou...
STATS:DATA+MODELS-W/DVD
The important reason for grouping data.
Introductory Statistics (10th Edition)
Interpreting a P-Value In Exercises 3–8, the P-value for a hypothesis test is shown. Use the P-value to decide ...
Elementary Statistics: Picturing the World (6th Edition)
Knowledge Booster


Learn more about
Need a deep-dive on the concept behind this application? Look no further. Learn more about this topic, statistics and related others by exploring similar questions and additional content below.Similar questions
- Calculate the 95% confidence intervals for the proportion of children surviving, and the proportion of non-crew adult passengers surviving. We want to use the given data to make inferences about the general population of all large boat crashes, so the data set should be treated as a random sample for this purpose. The 95% confidence interval for survival rate amongst non-crew adults runs from? (Round to one decimal place as needed. Use ascending order.) Frequency table results for Adult/Child: Group: Survival=Alive Count = 711 Adult/Child Frequency Relative Frequency Adult 654 0.91983122 Child 57 0.080168776 Frequency table results for Adult/Child: Group: Survival=Dead Count = 1490 Adult/Child Frequency Relative Frequency Adult 1438 0.96510067 Child 52 0.034899329 Frequency table results for Class: Group: Survival=Alive Count = 711 Class Frequency Relative Frequency Crew 212 0.29817159 First 203 0.28551336 Second 118 0.16596343 Third 178…arrow_forwardyou calculated the sample data to construct a 90% and 99% confidence interval for the average diameter of ball bearings produced from this manufacturing process. These confidence intervals were created using the Normal distribution based on the assumption that the population standard deviation is known and the sample size is sufficiently large. The confidence intervals rounded to two decimal places are: 90%= ( 2.40, 2.64) and 99% = (2.34, 2.70) Interpret both confidence intervals. Make sure to be detailed and precise in your interpretation. It has been claimed from previous studies that the average diameter of ball bearings from this manufacturing process is 2.30 cm. Based on the sample of 50 that you collected, is there evidence to suggest that the average diameter is greater than 2.30 cm? Perform a hypothesis test for the population mean at alpha = 0.01. In your initial post, address the following items: Define the null and alternative hypothesis for this test in mathematical…arrow_forwardBhuro.0p0arrow_forward
- Constructing Normal Quantile Plots. In Exercises 17–20, use the given data values to identify the corresponding z scores that are used for a normal quantile plot, then identify the coordinates of each point in the normal quantile plot. Construct the normal quantile plot, then determine whether the data appear to be from a population with a normal distribution. Brain Volumes A sample of human brain volumes (cm3) is obtained from those listed in Data Set 8 “IQ and Brain Size” in Appendix B: 1027, 1029, 1034, 1070, 1079, 1079, 963, 1439.arrow_forwardNever won gold Won at least one gold Total in the past X = 0 in the past X = 1 No gold in 2015 At least one gold in 2015 Total Y = 0 Y = 1 10 15 Y 20 20 30 35 Table 1: Distribution of countries who have won gold medals at the African Games In 2019 the African Games will be held in Morocco. In anticipation of the event, a group of researchers would like to know whether past success at the Games predicts the number of gold medals that countries bring home. They collect the data for the 35 countries that participated in the 2015 African Games to answer this question. 1. Formally define an experiment and explain why the data from the 35 coun- tries cannot constitute an experiment. 2. Table 1 above shows the joint distribution of winning a gold medal in the past (before 2015) (X), and in 2015 (Y). (a) Use this information to calculate the following conditional expectations. i. E (Υ | Χ = 0) ii. E(Y|X = 1) (b) Suppose you were interested in estimating the linear regression function E(Υ|Χ)…arrow_forwardII. A. Find the t-value corresponding to each level of confidence and degrees of freedom. 1. 90% confidence level and n= 12 2. 99% confidence level and n=20 3. a = 5% and n= 16 Aarrow_forward
- How do I solve it problem? I keep getting it incorrectarrow_forwardBlood pressure: High blood pressure has been identified as a risk factor for heart attacks and strokes. The proportion of U.S. adults with high blood pressure is 0.20 . A sample of 40 U.S. adults is chosen. Use Excel as needed. Part: 0 / 5 0 of 5 Parts Complete Part 1 of 5 (a) Is it appropriate to use the normal approximation to find the probability that more than 45% of the people in the sample have high blood pressure? If so, find the probability. If not, explain why not. It ▼(Choose one) appropriate to use the normal curve, since =np ▼(Choose one) 10 .arrow_forward1arrow_forward
- Determine the t critical value for a two-sided confidence interval in each of the following situations: a. Confidence level = 95%, df = 10 b. Confidence level = 95%, df = 15 c. Confidence level = 99%, df = 15 d. Confidence level = 99%, n = 5 e. Confidence level = 98%, df = 24 f. Confidence level = 99%, n = 38arrow_forwardScores on the Wechsler Adult Intelligence Scale are approximately normally distributed with 100 and σ=15. Use Table B or software to answer the following questions. What scores fall in the lowest 25% of the distribution? How high a score is needed to be in the highest 5%?arrow_forwardWhich of the following will decrease the width of a confidence interval I. Increasing the confidence level II. Decreasing the confidence level III. Increasing the sample size A. II and III B. II only C. I and III D. I onlyarrow_forward
arrow_back_ios
SEE MORE QUESTIONS
arrow_forward_ios
Recommended textbooks for you
 Glencoe Algebra 1, Student Edition, 9780079039897...AlgebraISBN:9780079039897Author:CarterPublisher:McGraw Hill
Glencoe Algebra 1, Student Edition, 9780079039897...
Algebra
ISBN:9780079039897
Author:Carter
Publisher:McGraw Hill
F- Test or F- statistic (F- Test of Equality of Variance); Author: Prof. Arvind Kumar Sing;https://www.youtube.com/watch?v=PdUt7InTyc8;License: Standard Youtube License
Statistics 101: F-ratio Test for Two Equal Variances; Author: Brandon Foltz;https://www.youtube.com/watch?v=UWQO4gX7-lE;License: Standard YouTube License, CC-BY
Hypothesis Testing and Confidence Intervals (FRM Part 1 – Book 2 – Chapter 5); Author: Analystprep;https://www.youtube.com/watch?v=vth3yZIUlGQ;License: Standard YouTube License, CC-BY
Understanding the Levene's Test for Equality of Variances in SPSS; Author: Dr. Todd Grande;https://www.youtube.com/watch?v=udJr8V2P8Xo;License: Standard Youtube License