
ELEMENTARY STATISTICS
13th Edition
ISBN: 9780135959732
Author: Triola
Publisher: PEARSON
expand_more
expand_more
format_list_bulleted
Videos
Textbook Question
Chapter 7.2, Problem 6BSC
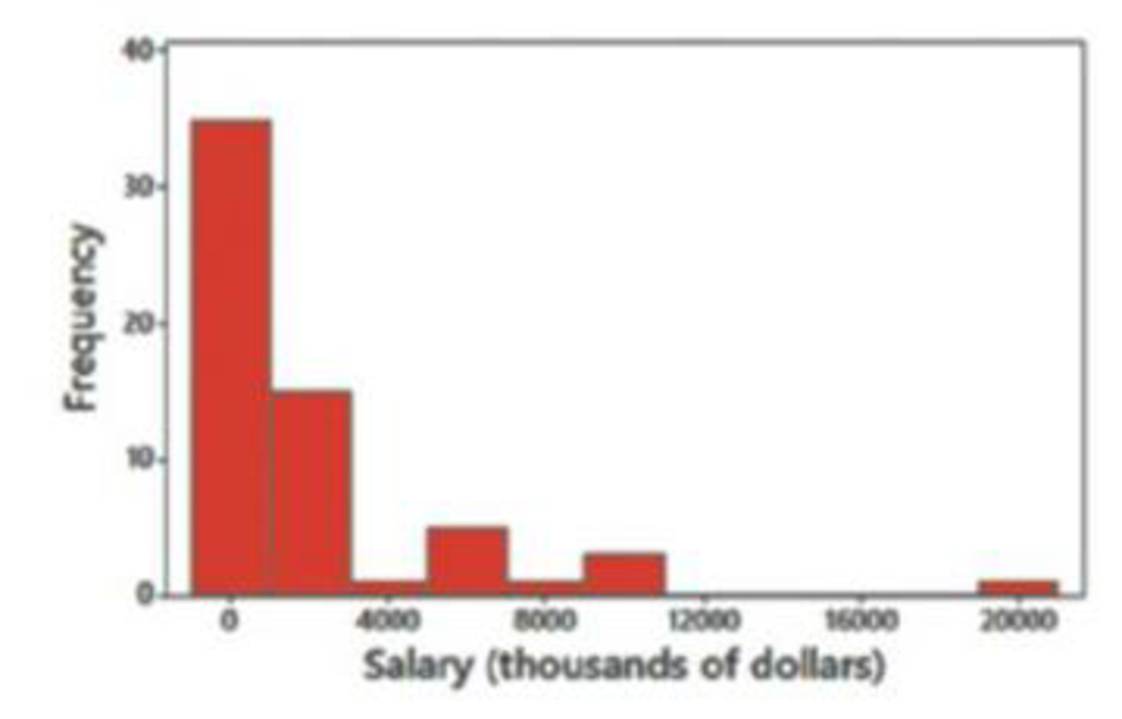
Using Correct Distribution. In Exercises 5–8, assume that we want to construct a confidence interval. Do one of the following, as appropriate: (a) Find the critical value tα/2, (b) find the critical value zα/2 or (c) state that neither the
6. Denver Bronco Salaries Confidence level is 90%, σ is not known, and the histogram of 61 player salaries (thousands of dollars) is as shown.
Expert Solution & Answer

Learn your wayIncludes step-by-step video

schedule01:50
Students have asked these similar questions
PEER REPLY 1:
Choose a classmate's Main Post.
1. Indicate a range of values for the independent variable (x) that is reasonable
based on the data provided.
2. Explain what the predicted range of dependent values should be based on
the range of independent values.
In a company with 80 employees, 60 earn $10.00 per hour and 20 earn $13.00 per
hour.
Is this average hourly wage considered representative?
The following is a list of questions answered correctly on an exam. Calculate the
Measures of Central Tendency from the ungrouped data list.
NUMBER OF QUESTIONS ANSWERED CORRECTLY ON AN APTITUDE EXAM
112
72
69
97
107
73
92
76
86
73
126
128
118
127
124
82
104
132
134
83
92
108
96
100
92
115
76
91
102
81
95
141
81
80
106
84
119
113
98
75
68
98
115
106
95
100
85
94
106
119
Chapter 7 Solutions
ELEMENTARY STATISTICS
Ch. 7.1 - Poll Results in the Media USA Today provided...Ch. 7.1 - Margin of Error For the poll described in Exercise...Ch. 7.1 - Notation For the poll described in Exercise 1,...Ch. 7.1 - Confidence Levels Given specific sample data, such...Ch. 7.1 - Finding Critical Values. In Exercises 58, find the...Ch. 7.1 - Finding Critical Values. In Exercises 58, find the...Ch. 7.1 - Finding Critical Values. In Exercises 58, find the...Ch. 7.1 - Finding Critical Values. In Exercises 58, find the...Ch. 7.1 - Formats of Confidence Intervals. In Exercises 912,...Ch. 7.1 - Formats of Confidence Intervals. In Exercises 912,...
Ch. 7.1 - Formats of Confidence Intervals. In Exercises 912,...Ch. 7.1 - Formats of Confidence Intervals. In Exercises 912,...Ch. 7.1 - Constructing and Interpreting Confidence...Ch. 7.1 - Constructing and Interpreting Confidence...Ch. 7.1 - Constructing and Interpreting Confidence...Ch. 7.1 - Constructing and Interpreting Confidence...Ch. 7.1 - Critical Thinking. In Exercises 1728, use the data...Ch. 7.1 - Critical Thinking. In Exercises 1728, use the data...Ch. 7.1 - Critical Thinking. In Exercises 1728, use the data...Ch. 7.1 - Critical Thinking. In Exercises 1728, use the data...Ch. 7.1 - Touch Therapy When she was 9 years of age, Emily...Ch. 7.1 - Critical Thinking. In Exercises 1728, use the data...Ch. 7.1 - Critical Thinking. In Exercises 1728, use the data...Ch. 7.1 - Critical Thinking. In Exercises 1728, use the data...Ch. 7.1 - Critical Thinking. In Exercises 1728, use the data...Ch. 7.1 - Critical Thinking. In Exercises 1728, use the data...Ch. 7.1 - Critical Thinking. In Exercises 1728, use the data...Ch. 7.1 - Critical Thinking. In Exercises 1728, use the data...Ch. 7.1 - Using Appendix B Data Sets. In Exercises 29 and...Ch. 7.1 - Using Appendix B Data Sets. In Exercises 29 and...Ch. 7.1 - Determining Sample Size. In Exercises 3138, use...Ch. 7.1 - Determining Sample Size. In Exercises 3138, use...Ch. 7.1 - Determining Sample Size. In Exercises 3138, use...Ch. 7.1 - Determining Sample Size. In Exercises 3138, use...Ch. 7.1 - Determining Sample Size. In Exercises 3138, use...Ch. 7.1 - Determining Sample Size. In Exercises 3138, use...Ch. 7.1 - Determining Sample Size. In Exercises 3138, use...Ch. 7.1 - Determining Sample Size. In Exercises 3138, use...Ch. 7.1 - Finite Population Correction Factor For Formulas...Ch. 7.1 - One-Sided Confidence Interval A one-sided claim...Ch. 7.1 - Coping with No Success According to the Rule of...Ch. 7.2 - In Exercises 13, refer to the accompanying screen...Ch. 7.2 - Statistical Literacy and Critical Thinking In...Ch. 7.2 - In Exercises 13, refer to the accompanying screen...Ch. 7.2 - Normality Requirement What does it mean when we...Ch. 7.2 - Using Correct Distribution. In Exercises 58,...Ch. 7.2 - Using Correct Distribution. In Exercises 58,...Ch. 7.2 - Using Correct Distribution. In Exercises 58,...Ch. 7.2 - Using Correct Distribution. In Exercises 58,...Ch. 7.2 - Confidence Intervals. In Exercises 924, construct...Ch. 7.2 - Confidence Intervals. In Exercises 924, construct...Ch. 7.2 - Confidence Intervals. In Exercises 924, construct...Ch. 7.2 - Confidence Intervals. In Exercises 924, construct...Ch. 7.2 - Confidence Intervals. In Exercises 924, construct...Ch. 7.2 - Confidence Intervals. In Exercises 924, construct...Ch. 7.2 - Confidence Intervals. In Exercises 924, construct...Ch. 7.2 - Confidence Intervals. In Exercises 924, construct...Ch. 7.2 - Confidence Intervals. In Exercises 924, construct...Ch. 7.2 - Confidence Intervals. In Exercises 924, construct...Ch. 7.2 - Confidence Intervals. In Exercises 924, construct...Ch. 7.2 - Confidence Intervals. In Exercises 924, construct...Ch. 7.2 - Confidence Intervals. In Exercises 924, construct...Ch. 7.2 - Confidence Intervals. In Exercises 924, construct...Ch. 7.2 - Confidence Intervals. In Exercises 924, construct...Ch. 7.2 - Confidence Intervals. In Exercises 924, construct...Ch. 7.2 - Appendix B Data Sets. In Exercises 2528, use the...Ch. 7.2 - Appendix B Data Sets. In Exercises 2528, use the...Ch. 7.2 - Appendix B Data Sets. In Exercises 2528, use the...Ch. 7.2 - Appendix B Data Sets. In Exercises 2528, use the...Ch. 7.2 - Sample Size. In Exercises 2936, find the sample...Ch. 7.2 - Sample Size. In Exercises 2936, find the sample...Ch. 7.2 - Sample Size. In Exercises 2936, find the sample...Ch. 7.2 - Sample Size. In Exercises 2936, find the sample...Ch. 7.2 - Sample Size. In Exercises 2936, find the sample...Ch. 7.2 - Sample Size. In Exercises 2936, find the sample...Ch. 7.2 - Sample Size. In Exercises 2936, find the sample...Ch. 7.2 - Sample Size. In Exercises 2936, find the sample...Ch. 7.2 - Confidence Interval with Known . In Exercises 37...Ch. 7.2 - Confidence Interval with Known . In Exercises 37...Ch. 7.2 - Finite Population Correction Factor If a simple...Ch. 7.3 - Brain Volume Using all of the brain volumes listed...Ch. 7.3 - Expressing Confidence Intervals Example 2 showed...Ch. 7.3 - Last Digit Analysis The dotplot below depicts the...Ch. 7.3 - Normality Requirement What is different about the...Ch. 7.3 - Finding Critical Values and Confidence Intervals....Ch. 7.3 - Finding Critical Values and Confidence Intervals....Ch. 7.3 - Finding Critical Values and Confidence Intervals....Ch. 7.3 - Finding Critical Values and Confidence Intervals....Ch. 7.3 - Finding Confidence Intervals. In Exercises 916,...Ch. 7.3 - Finding Confidence Intervals. In Exercises 916,...Ch. 7.3 - Finding Confidence Intervals. In Exercises 916,...Ch. 7.3 - Finding Confidence Intervals. In Exercises 916,...Ch. 7.3 - Finding Confidence Intervals. In Exercises 916,...Ch. 7.3 - Finding Confidence Intervals. In Exercises 916,...Ch. 7.3 - Finding Confidence Intervals. In Exercises 916,...Ch. 7.3 - Comparing Waiting Lines a. The values listed below...Ch. 7.3 - Large Data Sets from Appendix B. In Exercises 17...Ch. 7.3 - Large Data Sets from Appendix B. In Exercises 17...Ch. 7.3 - Determining Sample Size. In Exercises 1922, assume...Ch. 7.3 - Determining Sample Size. In Exercises 1922, assume...Ch. 7.3 - Determining Sample Size. In Exercises 1922, assume...Ch. 7.3 - Determining Sample Size. In Exercises 1922, assume...Ch. 7.3 - Finding Critical Values In constructing confidence...Ch. 7.3 - Finding Sample Size Instead of using Table 7-2 for...Ch. 7.4 - Replacement Why does the bootstrap method require...Ch. 7.4 - Bootstrap Sample Here is a random sample of...Ch. 7.4 - Bootstrap Sample Given the sample data from...Ch. 7.4 - Prob. 4BSCCh. 7.4 - In Exercises 58, use the relatively small number...Ch. 7.4 - In Exercises 58, use the relatively small number...Ch. 7.4 - In Exercises 58, use the relatively small number...Ch. 7.4 - In Exercises 58, use the relatively small number...Ch. 7 - Celebrities and the Law Here is a 95% confidence...Ch. 7 - Interpreting CI Write a brief statement that...Ch. 7 - Critical Value For the survey described in...Ch. 7 - Loose Change USA Today reported that 40% of people...Ch. 7 - Sample Size for Proportion Find the sample size...Ch. 7 - Sample Size for Mean Find the sample size required...Ch. 7 - Requirements A quality control analyst has...Ch. 7 - Degrees of Freedom In general, what does degrees...Ch. 7 - Critical Value Refer to Exercise 7 Requirements...Ch. 7 - Which Method? Refer to Exercise 7 Requirements and...Ch. 7 - Online News In a Harris poll of 2036 adults, 40%...Ch. 7 - Computers In order to better plan for student...Ch. 7 - Earthquake Magnitudes Listed below are Richter...Ch. 7 - Lefties There have been several studies conducted...Ch. 7 - Distributions Identify the distribution (normal,...Ch. 7 - Sample Size You have been hired by your new...Ch. 7 - Wristwatch Accuracy Students of the author...Ch. 7 - Wristwatch Accuracy Use the sample data from...Ch. 7 - Flight Arrivals. Listed below are the arrival...Ch. 7 - Flight Arrivals. Listed below are the arrival...Ch. 7 - Flight Arrivals. Listed below are the arrival...Ch. 7 - Flight Arrivals. Listed below are the arrival...Ch. 7 - Normal Distribution Using a larger data set than...Ch. 7 - Sample Size Find the sample size necessary to...Ch. 7 - Prob. 7CRECh. 7 - Normality Assessment A random sample consists of...Ch. 7 - Critical Thinking: What does the survey tell us?...Ch. 7 - Critical Thinking: What does the survey tell us?...Ch. 7 - Critical Thinking: What does the survey tell us?...Ch. 7 - Critical Thinking: What does the survey tell us?...Ch. 7 - Critical Thinking: What does the survey tell us?...
Additional Math Textbook Solutions
Find more solutions based on key concepts
CHECK POINT 1 In a survey on musical tastes, respondents were asked: Do you listed to classical music? Do you l...
Thinking Mathematically (6th Edition)
Consider a group of 20 people. If everyone shakes hands with everyone else, how many handshakes take place?
A First Course in Probability (10th Edition)
Children of First Ladies This list represents the number of children for the first six “first ladies” of the Un...
Introductory Statistics
Interpreting a P-Value In Exercises 3–8, the P-value for a hypothesis test is shown. Use the P-value to decide ...
Elementary Statistics: Picturing the World (7th Edition)
For what values of a is
continuous at every x?
University Calculus: Early Transcendentals (4th Edition)
Knowledge Booster


Learn more about
Need a deep-dive on the concept behind this application? Look no further. Learn more about this topic, statistics and related others by exploring similar questions and additional content below.Similar questions
- The following ordered data list shows the data speeds for cell phones used by a telephone company at an airport: A. Calculate the Measures of Central Tendency using the table in point B. B. Are there differences in the measurements obtained in A and C? Why (give at least one justified reason)? 0.8 1.4 1.8 1.9 3.2 3.6 4.5 4.5 4.6 6.2 6.5 7.7 7.9 9.9 10.2 10.3 10.9 11.1 11.1 11.6 11.8 12.0 13.1 13.5 13.7 14.1 14.2 14.7 15.0 15.1 15.5 15.8 16.0 17.5 18.2 20.2 21.1 21.5 22.2 22.4 23.1 24.5 25.7 28.5 34.6 38.5 43.0 55.6 71.3 77.8arrow_forwardIn a company with 80 employees, 60 earn $10.00 per hour and 20 earn $13.00 per hour. a) Determine the average hourly wage. b) In part a), is the same answer obtained if the 60 employees have an average wage of $10.00 per hour? Prove your answer.arrow_forwardThe following ordered data list shows the data speeds for cell phones used by a telephone company at an airport: A. Calculate the Measures of Central Tendency from the ungrouped data list. B. Group the data in an appropriate frequency table. 0.8 1.4 1.8 1.9 3.2 3.6 4.5 4.5 4.6 6.2 6.5 7.7 7.9 9.9 10.2 10.3 10.9 11.1 11.1 11.6 11.8 12.0 13.1 13.5 13.7 14.1 14.2 14.7 15.0 15.1 15.5 15.8 16.0 17.5 18.2 20.2 21.1 21.5 22.2 22.4 23.1 24.5 25.7 28.5 34.6 38.5 43.0 55.6 71.3 77.8arrow_forward
- Businessarrow_forwardhttps://www.hawkeslearning.com/Statistics/dbs2/datasets.htmlarrow_forwardNC Current Students - North Ce X | NC Canvas Login Links - North ( X Final Exam Comprehensive x Cengage Learning x WASTAT - Final Exam - STAT → C webassign.net/web/Student/Assignment-Responses/submit?dep=36055360&tags=autosave#question3659890_9 Part (b) Draw a scatter plot of the ordered pairs. N Life Expectancy Life Expectancy 80 70 600 50 40 30 20 10 Year of 1950 1970 1990 2010 Birth O Life Expectancy Part (c) 800 70 60 50 40 30 20 10 1950 1970 1990 W ALT 林 $ # 4 R J7 Year of 2010 Birth F6 4+ 80 70 60 50 40 30 20 10 Year of 1950 1970 1990 2010 Birth Life Expectancy Ox 800 70 60 50 40 30 20 10 Year of 1950 1970 1990 2010 Birth hp P.B. KA & 7 80 % 5 H A B F10 711 N M K 744 PRT SC ALT CTRLarrow_forward
- Harvard University California Institute of Technology Massachusetts Institute of Technology Stanford University Princeton University University of Cambridge University of Oxford University of California, Berkeley Imperial College London Yale University University of California, Los Angeles University of Chicago Johns Hopkins University Cornell University ETH Zurich University of Michigan University of Toronto Columbia University University of Pennsylvania Carnegie Mellon University University of Hong Kong University College London University of Washington Duke University Northwestern University University of Tokyo Georgia Institute of Technology Pohang University of Science and Technology University of California, Santa Barbara University of British Columbia University of North Carolina at Chapel Hill University of California, San Diego University of Illinois at Urbana-Champaign National University of Singapore McGill…arrow_forwardName Harvard University California Institute of Technology Massachusetts Institute of Technology Stanford University Princeton University University of Cambridge University of Oxford University of California, Berkeley Imperial College London Yale University University of California, Los Angeles University of Chicago Johns Hopkins University Cornell University ETH Zurich University of Michigan University of Toronto Columbia University University of Pennsylvania Carnegie Mellon University University of Hong Kong University College London University of Washington Duke University Northwestern University University of Tokyo Georgia Institute of Technology Pohang University of Science and Technology University of California, Santa Barbara University of British Columbia University of North Carolina at Chapel Hill University of California, San Diego University of Illinois at Urbana-Champaign National University of Singapore…arrow_forwardA company found that the daily sales revenue of its flagship product follows a normal distribution with a mean of $4500 and a standard deviation of $450. The company defines a "high-sales day" that is, any day with sales exceeding $4800. please provide a step by step on how to get the answers in excel Q: What percentage of days can the company expect to have "high-sales days" or sales greater than $4800? Q: What is the sales revenue threshold for the bottom 10% of days? (please note that 10% refers to the probability/area under bell curve towards the lower tail of bell curve) Provide answers in the yellow cellsarrow_forward
- Find the critical value for a left-tailed test using the F distribution with a 0.025, degrees of freedom in the numerator=12, and degrees of freedom in the denominator = 50. A portion of the table of critical values of the F-distribution is provided. Click the icon to view the partial table of critical values of the F-distribution. What is the critical value? (Round to two decimal places as needed.)arrow_forwardA retail store manager claims that the average daily sales of the store are $1,500. You aim to test whether the actual average daily sales differ significantly from this claimed value. You can provide your answer by inserting a text box and the answer must include: Null hypothesis, Alternative hypothesis, Show answer (output table/summary table), and Conclusion based on the P value. Showing the calculation is a must. If calculation is missing,so please provide a step by step on the answers Numerical answers in the yellow cellsarrow_forwardShow all workarrow_forward
arrow_back_ios
SEE MORE QUESTIONS
arrow_forward_ios
Recommended textbooks for you
 Glencoe Algebra 1, Student Edition, 9780079039897...AlgebraISBN:9780079039897Author:CarterPublisher:McGraw Hill
Glencoe Algebra 1, Student Edition, 9780079039897...
Algebra
ISBN:9780079039897
Author:Carter
Publisher:McGraw Hill
F- Test or F- statistic (F- Test of Equality of Variance); Author: Prof. Arvind Kumar Sing;https://www.youtube.com/watch?v=PdUt7InTyc8;License: Standard Youtube License
Statistics 101: F-ratio Test for Two Equal Variances; Author: Brandon Foltz;https://www.youtube.com/watch?v=UWQO4gX7-lE;License: Standard YouTube License, CC-BY
Hypothesis Testing and Confidence Intervals (FRM Part 1 – Book 2 – Chapter 5); Author: Analystprep;https://www.youtube.com/watch?v=vth3yZIUlGQ;License: Standard YouTube License, CC-BY
Understanding the Levene's Test for Equality of Variances in SPSS; Author: Dr. Todd Grande;https://www.youtube.com/watch?v=udJr8V2P8Xo;License: Standard Youtube License