
Bundle: Probability and Statistics for Engineering and the Sciences, 9th + WebAssign Printed Access Card for Devore's Probability and Statistics for ... and the Sciences, 9th Edition, Single-Term
9th Edition
ISBN: 9781305779372
Author: Jay L. Devore
Publisher: Cengage Learning
expand_more
expand_more
format_list_bulleted
Videos
Textbook Question
thumb_up100%
Chapter 7.2, Problem 17E
Exercise 1.13 gave a sample of ultimate tensile strength observations (ksi). Use the accompanying
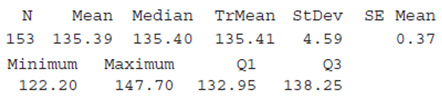
| N | TrMean | StDev | SE Mean | ||
| 153 | 135.39 | 135.40 | 135.41 | 4.59 | 0.37 |
| Minimum | Maximum | Q1 | Q3 |
| 122.20 | 147.70 | 132.95 | 138.25 |
Expert Solution & Answer

Trending nowThis is a popular solution!

Students have asked these similar questions
The following are suggested designs for group sequential studies. Using PROCSEQDESIGN, provide the following for the design O’Brien Fleming and Pocock.• The critical boundary values for each analysis of the data• The expected sample sizes at each interim analysisAssume the standardized Z score method for calculating boundaries.Investigators are evaluating the success rate of a novel drug for treating a certain type ofbacterial wound infection. Since no existing treatment exists, they have planned a one-armstudy. They wish to test whether the success rate of the drug is better than 50%, whichthey have defined as the null success rate. Preliminary testing has estimated the successrate of the drug at 55%. The investigators are eager to get the drug into production andwould like to plan for 9 interim analyses (10 analyzes in total) of the data. Assume thesignificance level is 5% and power is 90%.Besides, draw a combined boundary plot (OBF, POC, and HP)
Please provide the solution for the attached image in detailed.
20 km, because
GISS
Worksheet 10
Jesse runs a small business selling and delivering mealie meal to the spaza shops.
He charges a fixed rate of R80, 00 for delivery and then R15, 50 for each packet of
mealle meal he delivers. The table below helps him to calculate what to charge
his customers.
10
20
30
40
50
Packets of mealie
meal (m)
Total costs in Rands
80
235
390
545
700
855
(c)
10.1.
Define the following terms:
10.1.1. Independent Variables
10.1.2. Dependent Variables
10.2.
10.3.
10.4.
10.5.
Determine the independent and dependent variables.
Are the variables in this scenario discrete or continuous values? Explain
What shape do you expect the graph to be? Why?
Draw a graph on the graph provided to represent the information in the
table above.
TOTAL COST OF PACKETS OF MEALIE MEAL
900
800
700
600
COST (R)
500
400
300
200
100
0
10
20
30
40
60
NUMBER OF PACKETS OF MEALIE MEAL
Chapter 7 Solutions
Bundle: Probability and Statistics for Engineering and the Sciences, 9th + WebAssign Printed Access Card for Devore's Probability and Statistics for ... and the Sciences, 9th Edition, Single-Term
Ch. 7.1 - Consider a normal population distribution with the...Ch. 7.1 - Each of the following is a confidence interval for...Ch. 7.1 - Suppose that a random sample of 50 bottles of a...Ch. 7.1 - A CI is desired for the true average stray-load...Ch. 7.1 - Assume that the helium porosity (in percentage) of...Ch. 7.1 - On the basis of extensive tests, the yield point...Ch. 7.1 - By how much must the sample size n be increased if...Ch. 7.1 - Let 1 0, 2 0, with 1 + 2 = . Then P(z1X-/nz2)=1-...Ch. 7.1 - a. Under the same conditions as those leading to...Ch. 7.1 - A random sample of n = 15 heat pumps of a certain...
Ch. 7.1 - Consider the next 1000 95% CIs for that a...Ch. 7.2 - The following observations are lifetimes (days)...Ch. 7.2 - The article Gas Cooking. Kitchen Ventilation, and...Ch. 7.2 - The negative effects of ambient air pollution on...Ch. 7.2 - Determine the confidence level for each of the...Ch. 7.2 - The alternating current (AC) breakdown voltage of...Ch. 7.2 - Exercise 1.13 gave a sample of ultimate tensile...Ch. 7.2 - The U.S. Army commissioned a study to assess how...Ch. 7.2 - The article Limited Yield Estimation for Visual...Ch. 7.2 - TV advertising agencies face increasing challenges...Ch. 7.2 - In a sample of 1000 randomly selected consumers...Ch. 7.2 - The technology underlying hip replacements has...Ch. 7.2 - The Pew Forum on Religion and Public Life reported...Ch. 7.2 - A sample of 56 research cotton samples resulted in...Ch. 7.2 - The Pew Forum on Religion and Public Life reported...Ch. 7.2 - The superintendent of a large school district,...Ch. 7.2 - Reconsider the CI (7.10) for p, and focus on a...Ch. 7.3 - Determine the values of the following quantities:...Ch. 7.3 - Determine the t critical value(s) that will...Ch. 7.3 - Determine the t critical value for a two-sided...Ch. 7.3 - Determine the t critical value for a lower or an...Ch. 7.3 - According to the article Fatigue Testing of...Ch. 7.3 - The article Measuring and Understanding the Aging...Ch. 7.3 - A sample of 14 joint specimens of a particular...Ch. 7.3 - Silicone implant augmentation rhinoplasty is used...Ch. 7.3 - A normal probability plot of the n = 26...Ch. 7.3 - A study of the ability of individuals to walk in a...Ch. 7.3 - Ultra high performance concrete (UHPC) is a...Ch. 7.3 - Exercise 72 of Chapter 1 gave the following...Ch. 7.3 - Prob. 40ECh. 7.3 - A more extensive tabulation of t critical values...Ch. 7.4 - Determine the values of the following quantities:...Ch. 7.4 - Determine the following: a. The 95th percentile of...Ch. 7.4 - The amount of lateral expansion (mils) was...Ch. 7.4 - Wire electrical-discharge machining (WEDM) is a...Ch. 7.4 - Wire electrical-discharge machining (WEDM) is a...Ch. 7 - Example 1.11 introduced the accompanying...Ch. 7 - The article Distributions of Compressive Strength...Ch. 7 - For those of you who dont already know, dragon...Ch. 7 - A journal article reports that a sample of size 5...Ch. 7 - Unexplained respiratory symptoms reported by...Ch. 7 - High concentration of the toxic element arsenic is...Ch. 7 - Aphid infestation of fruit trees can be controlled...Ch. 7 - It is important that face masks used by...Ch. 7 - A manufacturer of college textbooks is interested...Ch. 7 - The accompanying data on crack initiation depth...Ch. 7 - In Example 6.8, we introduced the concept of a...Ch. 7 - Prob. 58SECh. 7 - Prob. 59SECh. 7 - Prob. 60SECh. 7 - Prob. 61SECh. 7 - Prob. 62SE
Knowledge Booster


Learn more about
Need a deep-dive on the concept behind this application? Look no further. Learn more about this topic, statistics and related others by exploring similar questions and additional content below.Similar questions
- Let X be a random variable with support SX = {−3, 0.5, 3, −2.5, 3.5}. Part ofits probability mass function (PMF) is given bypX(−3) = 0.15, pX(−2.5) = 0.3, pX(3) = 0.2, pX(3.5) = 0.15.(a) Find pX(0.5).(b) Find the cumulative distribution function (CDF), FX(x), of X.1(c) Sketch the graph of FX(x).arrow_forwardA well-known company predominantly makes flat pack furniture for students. Variability with the automated machinery means the wood components are cut with a standard deviation in length of 0.45 mm. After they are cut the components are measured. If their length is more than 1.2 mm from the required length, the components are rejected. a) Calculate the percentage of components that get rejected. b) In a manufacturing run of 1000 units, how many are expected to be rejected? c) The company wishes to install more accurate equipment in order to reduce the rejection rate by one-half, using the same ±1.2mm rejection criterion. Calculate the maximum acceptable standard deviation of the new process.arrow_forward5. Let X and Y be independent random variables and let the superscripts denote symmetrization (recall Sect. 3.6). Show that (X + Y) X+ys.arrow_forward
- 8. Suppose that the moments of the random variable X are constant, that is, suppose that EX" =c for all n ≥ 1, for some constant c. Find the distribution of X.arrow_forward9. The concentration function of a random variable X is defined as Qx(h) = sup P(x ≤ X ≤x+h), h>0. Show that, if X and Y are independent random variables, then Qx+y (h) min{Qx(h). Qr (h)).arrow_forward10. Prove that, if (t)=1+0(12) as asf->> O is a characteristic function, then p = 1.arrow_forward
- 9. The concentration function of a random variable X is defined as Qx(h) sup P(x ≤x≤x+h), h>0. (b) Is it true that Qx(ah) =aQx (h)?arrow_forward3. Let X1, X2,..., X, be independent, Exp(1)-distributed random variables, and set V₁₁ = max Xk and W₁ = X₁+x+x+ Isk≤narrow_forward7. Consider the function (t)=(1+|t|)e, ER. (a) Prove that is a characteristic function. (b) Prove that the corresponding distribution is absolutely continuous. (c) Prove, departing from itself, that the distribution has finite mean and variance. (d) Prove, without computation, that the mean equals 0. (e) Compute the density.arrow_forward
- 1. Show, by using characteristic, or moment generating functions, that if fx(x) = ½ex, -∞0 < x < ∞, then XY₁ - Y2, where Y₁ and Y2 are independent, exponentially distributed random variables.arrow_forward1. Show, by using characteristic, or moment generating functions, that if 1 fx(x): x) = ½exarrow_forward1990) 02-02 50% mesob berceus +7 What's the probability of getting more than 1 head on 10 flips of a fair coin?arrow_forward
arrow_back_ios
SEE MORE QUESTIONS
arrow_forward_ios
Recommended textbooks for you
 Glencoe Algebra 1, Student Edition, 9780079039897...AlgebraISBN:9780079039897Author:CarterPublisher:McGraw Hill
Glencoe Algebra 1, Student Edition, 9780079039897...
Algebra
ISBN:9780079039897
Author:Carter
Publisher:McGraw Hill
Hypothesis Testing using Confidence Interval Approach; Author: BUM2413 Applied Statistics UMP;https://www.youtube.com/watch?v=Hq1l3e9pLyY;License: Standard YouTube License, CC-BY
Hypothesis Testing - Difference of Two Means - Student's -Distribution & Normal Distribution; Author: The Organic Chemistry Tutor;https://www.youtube.com/watch?v=UcZwyzwWU7o;License: Standard Youtube License