ELEMENTARY STATISTICS-W/ACCESS >CUSTOM<
3rd Edition
ISBN: 9781323594889
Author: Triola
Publisher: PEARSON C
expand_more
expand_more
format_list_bulleted
Videos
Textbook Question
Chapter 7.2, Problem 15BSC
Confidence Intervals. In Exercises 9–24, construct the confidence
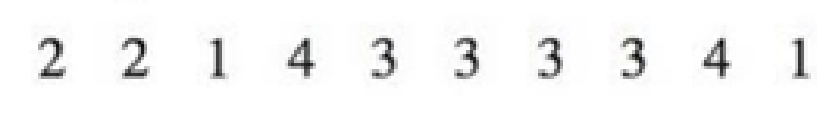
15. Genes Samples of DNA are collected, and the four DNA bases of A, G, C, and T are coded as 1, 2, 3, and 4, respectively. The results are listed below. Construct a 95% confidence interval estimate of the mean. What is the practical use of the confidence interval?
Expert Solution & Answer

Learn your wayIncludes step-by-step video

schedule10:47
Students have asked these similar questions
30% of all college students major in STEM (Science, Technology, Engineering, and Math). If 48 college students are randomly selected, find the probability thata. Exactly 12 of them major in STEM. b. At most 17 of them major in STEM. c. At least 12 of them major in STEM. d. Between 9 and 13 (including 9 and 13) of them major in STEM.
7% of all Americans live in poverty. If 40 Americans are randomly selected, find the probability thata. Exactly 4 of them live in poverty. b. At most 1 of them live in poverty. c. At least 1 of them live in poverty. d. Between 2 and 9 (including 2 and 9) of them live in poverty.
48% of all violent felons in the prison system are repeat offenders. If 40 violent felons are randomly selected, find the probability that
a. Exactly 18 of them are repeat offenders. b. At most 18 of them are repeat offenders. c. At least 18 of them are repeat offenders. d. Between 17 and 21 (including 17 and 21) of them are repeat offenders.
Chapter 7 Solutions
ELEMENTARY STATISTICS-W/ACCESS >CUSTOM<
Ch. 7.1 - Poll Results in the Media USA Today provided...Ch. 7.1 - Margin of Error For the poll described in Exercise...Ch. 7.1 - Notation For the poll described in Exercise 1,...Ch. 7.1 - Confidence Levels Given specific sample data, such...Ch. 7.1 - Finding Critical Values. In Exercises 58, find the...Ch. 7.1 - Finding Critical Values. In Exercises 58, find the...Ch. 7.1 - Finding Critical Values. In Exercises 58, find the...Ch. 7.1 - Finding Critical Values. In Exercises 58, find the...Ch. 7.1 - Formats of Confidence Intervals. In Exercises 912,...Ch. 7.1 - Formats of Confidence Intervals. In Exercises 912,...
Ch. 7.1 - Formats of Confidence Intervals. In Exercises 912,...Ch. 7.1 - Formats of Confidence Intervals. In Exercises 912,...Ch. 7.1 - Constructing and Interpreting Confidence...Ch. 7.1 - Constructing and Interpreting Confidence...Ch. 7.1 - Constructing and Interpreting Confidence...Ch. 7.1 - Constructing and Interpreting Confidence...Ch. 7.1 - Critical Thinking. In Exercises 1728, use the data...Ch. 7.1 - Critical Thinking. In Exercises 1728, use the data...Ch. 7.1 - Critical Thinking. In Exercises 1728, use the data...Ch. 7.1 - Critical Thinking. In Exercises 1728, use the data...Ch. 7.1 - Touch Therapy When she was 9 years of age, Emily...Ch. 7.1 - Critical Thinking. In Exercises 1728, use the data...Ch. 7.1 - Critical Thinking. In Exercises 1728, use the data...Ch. 7.1 - Critical Thinking. In Exercises 1728, use the data...Ch. 7.1 - Critical Thinking. In Exercises 1728, use the data...Ch. 7.1 - Critical Thinking. In Exercises 1728, use the data...Ch. 7.1 - Critical Thinking. In Exercises 1728, use the data...Ch. 7.1 - Critical Thinking. In Exercises 1728, use the data...Ch. 7.1 - Using Appendix B Data Sets. In Exercises 29 and...Ch. 7.1 - Using Appendix B Data Sets. In Exercises 29 and...Ch. 7.1 - Determining Sample Size. In Exercises 3138, use...Ch. 7.1 - Determining Sample Size. In Exercises 3138, use...Ch. 7.1 - Determining Sample Size. In Exercises 3138, use...Ch. 7.1 - Determining Sample Size. In Exercises 3138, use...Ch. 7.1 - Determining Sample Size. In Exercises 3138, use...Ch. 7.1 - Determining Sample Size. In Exercises 3138, use...Ch. 7.1 - Determining Sample Size. In Exercises 3138, use...Ch. 7.1 - Determining Sample Size. In Exercises 3138, use...Ch. 7.1 - Finite Population Correction Factor For Formulas...Ch. 7.1 - One-Sided Confidence Interval A one-sided claim...Ch. 7.1 - Coping with No Success According to the Rule of...Ch. 7.2 - In Exercises 13, refer to the accompanying screen...Ch. 7.2 - Statistical Literacy and Critical Thinking In...Ch. 7.2 - In Exercises 13, refer to the accompanying screen...Ch. 7.2 - Normality Requirement What does it mean when we...Ch. 7.2 - Using Correct Distribution. In Exercises 58,...Ch. 7.2 - Using Correct Distribution. In Exercises 58,...Ch. 7.2 - Using Correct Distribution. In Exercises 58,...Ch. 7.2 - Using Correct Distribution. In Exercises 58,...Ch. 7.2 - Confidence Intervals. In Exercises 924, construct...Ch. 7.2 - Confidence Intervals. In Exercises 924, construct...Ch. 7.2 - Confidence Intervals. In Exercises 924, construct...Ch. 7.2 - Confidence Intervals. In Exercises 924, construct...Ch. 7.2 - Confidence Intervals. In Exercises 924, construct...Ch. 7.2 - Confidence Intervals. In Exercises 924, construct...Ch. 7.2 - Confidence Intervals. In Exercises 924, construct...Ch. 7.2 - Confidence Intervals. In Exercises 924, construct...Ch. 7.2 - Confidence Intervals. In Exercises 924, construct...Ch. 7.2 - Confidence Intervals. In Exercises 924, construct...Ch. 7.2 - Confidence Intervals. In Exercises 924, construct...Ch. 7.2 - Confidence Intervals. In Exercises 924, construct...Ch. 7.2 - Confidence Intervals. In Exercises 924, construct...Ch. 7.2 - Confidence Intervals. In Exercises 924, construct...Ch. 7.2 - Confidence Intervals. In Exercises 924, construct...Ch. 7.2 - Confidence Intervals. In Exercises 924, construct...Ch. 7.2 - Appendix B Data Sets. In Exercises 2528, use the...Ch. 7.2 - Appendix B Data Sets. In Exercises 2528, use the...Ch. 7.2 - Appendix B Data Sets. In Exercises 2528, use the...Ch. 7.2 - Appendix B Data Sets. In Exercises 2528, use the...Ch. 7.2 - Sample Size. In Exercises 2936, find the sample...Ch. 7.2 - Sample Size. In Exercises 2936, find the sample...Ch. 7.2 - Sample Size. In Exercises 2936, find the sample...Ch. 7.2 - Sample Size. In Exercises 2936, find the sample...Ch. 7.2 - Sample Size. In Exercises 2936, find the sample...Ch. 7.2 - Sample Size. In Exercises 2936, find the sample...Ch. 7.2 - Sample Size. In Exercises 2936, find the sample...Ch. 7.2 - Sample Size. In Exercises 2936, find the sample...Ch. 7.2 - Confidence Interval with Known . In Exercises 37...Ch. 7.2 - Confidence Interval with Known . In Exercises 37...Ch. 7.2 - Finite Population Correction Factor If a simple...Ch. 7.3 - Brain Volume Using all of the brain volumes listed...Ch. 7.3 - Expressing Confidence Intervals Example 2 showed...Ch. 7.3 - Last Digit Analysis The dotplot below depicts the...Ch. 7.3 - Normality Requirement What is different about the...Ch. 7.3 - Finding Critical Values and Confidence Intervals....Ch. 7.3 - Finding Critical Values and Confidence Intervals....Ch. 7.3 - Finding Critical Values and Confidence Intervals....Ch. 7.3 - Finding Critical Values and Confidence Intervals....Ch. 7.3 - Finding Confidence Intervals. In Exercises 916,...Ch. 7.3 - Finding Confidence Intervals. In Exercises 916,...Ch. 7.3 - Finding Confidence Intervals. In Exercises 916,...Ch. 7.3 - Finding Confidence Intervals. In Exercises 916,...Ch. 7.3 - Finding Confidence Intervals. In Exercises 916,...Ch. 7.3 - Finding Confidence Intervals. In Exercises 916,...Ch. 7.3 - Finding Confidence Intervals. In Exercises 916,...Ch. 7.3 - Comparing Waiting Lines a. The values listed below...Ch. 7.3 - Large Data Sets from Appendix B. In Exercises 17...Ch. 7.3 - Large Data Sets from Appendix B. In Exercises 17...Ch. 7.3 - Determining Sample Size. In Exercises 1922, assume...Ch. 7.3 - Determining Sample Size. In Exercises 1922, assume...Ch. 7.3 - Determining Sample Size. In Exercises 1922, assume...Ch. 7.3 - Determining Sample Size. In Exercises 1922, assume...Ch. 7.3 - Finding Critical Values In constructing confidence...Ch. 7.3 - Finding Sample Size Instead of using Table 7-2 for...Ch. 7.4 - Replacement Why does the bootstrap method require...Ch. 7.4 - Bootstrap Sample Here is a random sample of...Ch. 7.4 - Bootstrap Sample Given the sample data from...Ch. 7.4 - Prob. 4BSCCh. 7.4 - In Exercises 58, use the relatively small number...Ch. 7.4 - In Exercises 58, use the relatively small number...Ch. 7.4 - In Exercises 58, use the relatively small number...Ch. 7.4 - In Exercises 58, use the relatively small number...Ch. 7 - Celebrities and the Law Here is a 95% confidence...Ch. 7 - Interpreting CI Write a brief statement that...Ch. 7 - Critical Value For the survey described in...Ch. 7 - Loose Change USA Today reported that 40% of people...Ch. 7 - Sample Size for Proportion Find the sample size...Ch. 7 - Sample Size for Mean Find the sample size required...Ch. 7 - Requirements A quality control analyst has...Ch. 7 - Degrees of Freedom In general, what does degrees...Ch. 7 - Critical Value Refer to Exercise 7 Requirements...Ch. 7 - Which Method? Refer to Exercise 7 Requirements and...Ch. 7 - Online News In a Harris poll of 2036 adults, 40%...Ch. 7 - Computers In order to better plan for student...Ch. 7 - Earthquake Magnitudes Listed below are Richter...Ch. 7 - Lefties There have been several studies conducted...Ch. 7 - Distributions Identify the distribution (normal,...Ch. 7 - Sample Size You have been hired by your new...Ch. 7 - Wristwatch Accuracy Students of the author...Ch. 7 - Wristwatch Accuracy Use the sample data from...Ch. 7 - Flight Arrivals. Listed below are the arrival...Ch. 7 - Flight Arrivals. Listed below are the arrival...Ch. 7 - Flight Arrivals. Listed below are the arrival...Ch. 7 - Flight Arrivals. Listed below are the arrival...Ch. 7 - Normal Distribution Using a larger data set than...Ch. 7 - Sample Size Find the sample size necessary to...Ch. 7 - Prob. 7CRECh. 7 - Normality Assessment A random sample consists of...Ch. 7 - Critical Thinking: What does the survey tell us?...Ch. 7 - Critical Thinking: What does the survey tell us?...Ch. 7 - Critical Thinking: What does the survey tell us?...Ch. 7 - Critical Thinking: What does the survey tell us?...Ch. 7 - Critical Thinking: What does the survey tell us?...
Additional Math Textbook Solutions
Find more solutions based on key concepts
Sisters and Brothers The scatterplot shows the numbers of brothers and sisters for a large number of students. ...
Introductory Statistics
CHECK POINT I Express as a percent.
Thinking Mathematically (6th Edition)
The conjugate of 43i is _______. (p. A59)
Precalculus
Identifying Type I and Type II Errors In Exercises 31–36, describe type I and type II errors for a hypothesis t...
Elementary Statistics: Picturing the World (7th Edition)
Explain the meaning of the term “statistically significant difference” in statistics terminology.
Intro Stats, Books a la Carte Edition (5th Edition)
Finding Cartesian from Parametric Equations
Exercises 1–18 give parametric equations and parameter intervals fo...
University Calculus: Early Transcendentals (4th Edition)
Knowledge Booster


Learn more about
Need a deep-dive on the concept behind this application? Look no further. Learn more about this topic, statistics and related others by exploring similar questions and additional content below.Similar questions
- Consider an MA(6) model with θ1 = 0.5, θ2 = −25, θ3 = 0.125, θ4 = −0.0625, θ5 = 0.03125, and θ6 = −0.015625. Find a much simpler model that has nearly the same ψ-weights.arrow_forwardLet {Yt} be an AR(2) process of the special form Yt = φ2Yt − 2 + et. Use first principles to find the range of values of φ2 for which the process is stationary.arrow_forwardDescribe the important characteristics of the autocorrelation function for the following models: (a) MA(1), (b) MA(2), (c) AR(1), (d) AR(2), and (e) ARMA(1,1).arrow_forward
- « CENGAGE MINDTAP Quiz: Chapter 38 Assignment: Quiz: Chapter 38 ips Questions ra1kw08h_ch38.15m 13. 14. 15. O Which sentence has modifiers in the correct place? O a. When called, she for a medical emergency responds quickly. b. Without giving away too much of the plot, Helena described the heroine's actions in the film. O c. Nearly the snakebite victim died before the proper antitoxin was injected. . O O 16 16. O 17. 18. O 19. O 20 20. 21 21. 22. 22 DS 23. 23 24. 25. O O Oarrow_forwardQuestions ra1kw08h_ch36.14m 12. 13. 14. 15. 16. Ӧ 17. 18. 19. OS 20. Two separate sentences need Oa. two separate subjects. Ob. two dependent clauses. c. one shared subject.arrow_forwardCustomers experiencing technical difficulty with their Internet cable service may call an 800 number for technical support. It takes the technician between 30 seconds and 11 minutes to resolve the problem. The distribution of this support time follows the uniform distribution. Required: a. What are the values for a and b in minutes? Note: Do not round your intermediate calculations. Round your answers to 1 decimal place. b-1. What is the mean time to resolve the problem? b-2. What is the standard deviation of the time? c. What percent of the problems take more than 5 minutes to resolve? d. Suppose we wish to find the middle 50% of the problem-solving times. What are the end points of these two times?arrow_forward
- Exercise 6-6 (Algo) (LO6-3) The director of admissions at Kinzua University in Nova Scotia estimated the distribution of student admissions for the fall semester on the basis of past experience. Admissions Probability 1,100 0.5 1,400 0.4 1,300 0.1 Click here for the Excel Data File Required: What is the expected number of admissions for the fall semester? Compute the variance and the standard deviation of the number of admissions. Note: Round your standard deviation to 2 decimal places.arrow_forward1. Find the mean of the x-values (x-bar) and the mean of the y-values (y-bar) and write/label each here: 2. Label the second row in the table using proper notation; then, complete the table. In the fifth and sixth columns, show the 'products' of what you're multiplying, as well as the answers. X y x minus x-bar y minus y-bar (x minus x-bar)(y minus y-bar) (x minus x-bar)^2 xy 16 20 34 4-2 5 2 3. Write the sums that represents Sxx and Sxy in the table, at the bottom of their respective columns. 4. Find the slope of the Regression line: bi = (simplify your answer) 5. Find the y-intercept of the Regression line, and then write the equation of the Regression line. Show your work. Then, BOX your final answer. Express your line as "y-hat equals...arrow_forwardApply STATA commands & submit the output for each question only when indicated below i. Generate the log of birthweight and family income of children. Name these new variables Ibwght & Ifaminc. Include the output of this code. ii. Apply the command sum with the detail option to the variable faminc. Note: you should find the 25th percentile value, the 50th percentile and the 75th percentile value of faminc from the output - you will need it to answer the next question Include the output of this code. iii. iv. Use the output from part ii of this question to Generate a variable called "high_faminc" that takes a value 1 if faminc is less than or equal to the 25th percentile, it takes the value 2 if faminc is greater than 25th percentile but less than or equal to the 50th percentile, it takes the value 3 if faminc is greater than 50th percentile but less than or equal to the 75th percentile, it takes the value 4 if faminc is greater than the 75th percentile. Include the outcome of this code…arrow_forward
- solve this on paperarrow_forwardApply STATA commands & submit the output for each question only when indicated below i. Apply the command egen to create a variable called "wyd" which is the rowtotal function on variables bwght & faminc. ii. Apply the list command for the first 10 observations to show that the code in part i worked. Include the outcome of this code iii. Apply the egen command to create a new variable called "bwghtsum" using the sum function on variable bwght by the variable high_faminc (Note: need to apply the bysort' statement) iv. Apply the "by high_faminc" statement to find the V. descriptive statistics of bwght and bwghtsum Include the output of this code. Why is there a difference between the standard deviations of bwght and bwghtsum from part iv of this question?arrow_forwardAccording to a health information website, the distribution of adults’ diastolic blood pressure (in millimeters of mercury, mmHg) can be modeled by a normal distribution with mean 70 mmHg and standard deviation 20 mmHg. b. Above what diastolic pressure would classify someone in the highest 1% of blood pressures? Show all calculations used.arrow_forward
arrow_back_ios
SEE MORE QUESTIONS
arrow_forward_ios
Recommended textbooks for you
 Glencoe Algebra 1, Student Edition, 9780079039897...AlgebraISBN:9780079039897Author:CarterPublisher:McGraw Hill
 Big Ideas Math A Bridge To Success Algebra 1: Stu...AlgebraISBN:9781680331141Author:HOUGHTON MIFFLIN HARCOURTPublisher:Houghton Mifflin Harcourt
 Holt Mcdougal Larson Pre-algebra: Student Edition...AlgebraISBN:9780547587776Author:HOLT MCDOUGALPublisher:HOLT MCDOUGAL
 Linear Algebra: A Modern IntroductionAlgebraISBN:9781285463247Author:David PoolePublisher:Cengage Learning
Glencoe Algebra 1, Student Edition, 9780079039897...
Algebra
ISBN:9780079039897
Author:Carter
Publisher:McGraw Hill
Big Ideas Math A Bridge To Success Algebra 1: Stu...
Algebra
ISBN:9781680331141
Author:HOUGHTON MIFFLIN HARCOURT
Publisher:Houghton Mifflin Harcourt
Holt Mcdougal Larson Pre-algebra: Student Edition...
Algebra
ISBN:9780547587776
Author:HOLT MCDOUGAL
Publisher:HOLT MCDOUGAL
Linear Algebra: A Modern Introduction
Algebra
ISBN:9781285463247
Author:David Poole
Publisher:Cengage Learning
Hypothesis Testing using Confidence Interval Approach; Author: BUM2413 Applied Statistics UMP;https://www.youtube.com/watch?v=Hq1l3e9pLyY;License: Standard YouTube License, CC-BY
Hypothesis Testing - Difference of Two Means - Student's -Distribution & Normal Distribution; Author: The Organic Chemistry Tutor;https://www.youtube.com/watch?v=UcZwyzwWU7o;License: Standard Youtube License