
ALEKS 360 ELEM STATISTICS
10th Edition
ISBN: 9781264241385
Author: Bluman
Publisher: MCG
expand_more
expand_more
format_list_bulleted
Videos
Textbook Question
Chapter 7.2, Problem 10E
For Exercises 5 through 20, assume that all variables are approximately
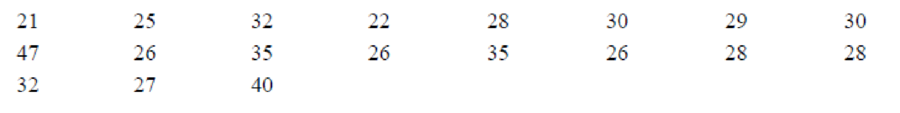
10. Dance Company Students The number of students who belong to the dance company at each of several randomly selected small universities is shown here. Estimate the true population
Expert Solution & Answer
Want to see the full answer?
Check out a sample textbook solution
Students have asked these similar questions
https://www.hawkeslearning.com/Statistics/dbs2/datasets.html
NC Current Students - North Ce X | NC Canvas Login Links - North ( X
Final Exam Comprehensive x Cengage Learning
x
WASTAT - Final Exam - STAT
→
C
webassign.net/web/Student/Assignment-Responses/submit?dep=36055360&tags=autosave#question3659890_9
Part (b)
Draw a scatter plot of the ordered pairs.
N
Life
Expectancy
Life
Expectancy
80
70
600
50
40
30
20
10
Year of
1950
1970 1990
2010 Birth
O
Life
Expectancy
Part (c)
800
70
60
50
40
30
20
10
1950
1970 1990
W
ALT
林
$
#
4
R
J7
Year of
2010 Birth
F6
4+
80
70
60
50
40
30
20
10
Year of
1950 1970 1990
2010 Birth
Life
Expectancy
Ox
800
70
60
50
40
30
20
10
Year of
1950 1970 1990 2010 Birth
hp
P.B.
KA
&
7
80
% 5
H
A
B
F10
711
N
M
K
744
PRT SC
ALT
CTRL
Harvard University
California Institute of Technology
Massachusetts Institute of Technology
Stanford University
Princeton University
University of Cambridge
University of Oxford
University of California, Berkeley
Imperial College London
Yale University
University of California, Los Angeles
University of Chicago
Johns Hopkins University
Cornell University
ETH Zurich
University of Michigan
University of Toronto
Columbia University
University of Pennsylvania
Carnegie Mellon University
University of Hong Kong
University College London
University of Washington
Duke University
Northwestern University
University of Tokyo
Georgia Institute of Technology
Pohang University of Science and Technology
University of California, Santa Barbara
University of British Columbia
University of North Carolina at Chapel Hill
University of California, San Diego
University of Illinois at Urbana-Champaign
National University of Singapore
McGill…
Chapter 7 Solutions
ALEKS 360 ELEM STATISTICS
Ch. 7.1 - What is the difference between a point estimate...Ch. 7.1 - What information is necessary to calculate a...Ch. 7.1 - What is the margin of error?Ch. 7.1 - What is meant by the 95% confidence interval of...Ch. 7.1 - What are three properties of a good estimator?Ch. 7.1 - What statistic best estimates ?Ch. 7.1 - Find each. a. z/2 for the 99% confidence interval...Ch. 7.1 - What is necessary to determine the sample size?Ch. 7.1 - Fuel Efficiency of Cars and Trucks Since 1975 the...Ch. 7.1 - Fast-Food Bills for Drive-Thru Customers A random...
Ch. 7.1 - Overweight Men For a random sample of 60...Ch. 7.1 - Number of Jobs A sociologist found that in a...Ch. 7.1 - Number of Faculty The numbers of faculty at 32...Ch. 7.1 - Freshmen GPAs First-semester GPAs for a random...Ch. 7.1 - Carbohydrate Grams in Commercial Subs The number...Ch. 7.1 - Number of Farms A random sample of the number of...Ch. 7.1 - Gasoline Use A random sample of 36 drivers used on...Ch. 7.1 - Day Care Tuition A random sample of 50...Ch. 7.1 - Hospital Noise Levels Noise levels at various area...Ch. 7.1 - Length of Growing Seasons The growing seasons for...Ch. 7.1 - Christmas Presents How large a sample is needed to...Ch. 7.1 - Hospital Noise Levels In the hospital study cited...Ch. 7.1 - Internet Viewing A researcher wishes to estimate...Ch. 7.1 - Cost of Pizzas A pizza shop owner wishes to find...Ch. 7.1 - Water Temperature If the variance of the water...Ch. 7.1 - Undergraduate GPAs It is desired to estimate the...Ch. 7.2 - Sport Drink Decision Assume you get a new job as a...Ch. 7.2 - What are the properties of the t distribution?Ch. 7.2 - What is meant by degrees of freedom?Ch. 7.2 - Find the values for each. a. t/2 and n = 18 for...Ch. 7.2 - When should the t distribution be used to find a...Ch. 7.2 - For Exercises 5 through 20, assume that all...Ch. 7.2 - For Exercises 5 through 20, assume that all...Ch. 7.2 - For Exercises 5 through 20, assume that all...Ch. 7.2 - For Exercises 5 through 20, assume that all...Ch. 7.2 - For Exercises 5 through 20, assume that all...Ch. 7.2 - For Exercises 5 through 20, assume that all...Ch. 7.2 - For Exercises 5 through 20, assume that all...Ch. 7.2 - For Exercises 5 through 20, assume that all...Ch. 7.2 - For Exercises 5 through 20, assume that all...Ch. 7.2 - For Exercises 5 through 20, assume that all...Ch. 7.2 - For Exercises 5 through 20, assume that all...Ch. 7.2 - For Exercises 5 through 20, assume that all...Ch. 7.2 - For Exercises 5 through 20, assume that all...Ch. 7.2 - For Exercises 5 through 20, assume that all...Ch. 7.2 - For Exercises 5 through 20, assume that all...Ch. 7.2 - For Exercises 5 through 20, assume that all...Ch. 7.2 - Parking Meter Revenue A one-sided confidence...Ch. 7.3 - Contracting Influenza To answer the questions, use...Ch. 7.3 - In each case, find p and q. a. n = 80 and X = 40...Ch. 7.3 - Find p and q for each situation. a. n = 60 and X =...Ch. 7.3 - Cyber Monday Shopping A survey of 1000 U.S. adults...Ch. 7.3 - Manual Transmission Automobiles In 2014, six...Ch. 7.3 - Holiday Gifts A survey of 100 Americans found that...Ch. 7.3 - Belief in Haunted Places A random sample of 205...Ch. 7.3 - Work Interruptions Research by Steelcase found the...Ch. 7.3 - Travel to Outer Space A CBS News/New York Times...Ch. 7.3 - High School Graduates Who Take the SAT The...Ch. 7.3 - Educational Television In a random sample of 200...Ch. 7.3 - Wi-Fi Access A survey of 50 students in grades 4...Ch. 7.3 - Students Who Major in Business It has been...Ch. 7.3 - Smartphone Ownership A recent survey of 349 people...Ch. 7.3 - Home Internet Access According to a study, 96% of...Ch. 7.3 - Overseas Travel A researcher wishes to be 95%...Ch. 7.3 - Widows A recent study indicated that 29% of the...Ch. 7.3 - Direct Satellite Television It is believed that...Ch. 7.3 - Obesity Obesity is defined as a body mass index...Ch. 7.3 - U.S. Fitness Guidelines According to the World...Ch. 7.3 - Diet Habits A federal report indicated that 27% of...Ch. 7.3 - Gun Control If a random sample of 600 people is...Ch. 7.3 - Survey on Politics In a study, 68% of 1015...Ch. 7.4 - Ages of Presidents at the Time of Their Deaths...Ch. 7.4 - What distribution must be used when computing...Ch. 7.4 - What assumption must be made when computing...Ch. 7.4 - Using Table G, find the values for 2 left and 2...Ch. 7.4 - Lifetimes of Wristwatches Find the 90% confidence...Ch. 7.4 - Carbohydrates in Yogurt The number of...Ch. 7.4 - Carbon Monoxide Deaths A study of...Ch. 7.4 - Pacemaker Batteries A manufacturer of pacemakers...Ch. 7.4 - Age of College Students Find the 90% confidence...Ch. 7.4 - Prob. 9ECh. 7.4 - Stock Prices A random sample of stock prices per...Ch. 7.4 - Cost of an Operation A medical researcher surveyed...Ch. 7.4 - Home Ownership Rates The percentage rates of home...Ch. 7.4 - Calories in a Standard Size Candy Bar Estimate the...Ch. 7.4 - SAT Scores Estimate the variance in mean...Ch. 7.4 - Daily Cholesterol Intake The American Heart...Ch. 7.4 - Calculator Battery Lifetimes A confidence interval...Ch. 7 - Eye Blinks A survey of 49 individuals found that...Ch. 7 - Vacation Days A U.S. Travel Data Center survey...Ch. 7 - Blood Pressure A researcher wishes to estimate...Ch. 7 - Shopping Survey A random sample of 49 shoppers...Ch. 7 - Lengths of Childrens Animated Films The lengths...Ch. 7 - Dog Bites to Postal Workers For a certain urban...Ch. 7 - Number of Credit Cards In a recent survey of 1000...Ch. 7 - Vacation Sites A U.S. Travel Data Centers survey...Ch. 7 - Prob. 7.3.9RECh. 7 - Adult Educational Activities A local county has a...Ch. 7 - Prob. 7.3.11RECh. 7 - Child Care Programs A study found that 73% of...Ch. 7 - Baseball Diameters The standard deviation of the...Ch. 7 - Cost of an Operation A medical researcher surveyed...Ch. 7 - Lifetimes of Snowmobiles A random sample of 15...Ch. 7 - Length of Childrens Animated Films Use the data...Ch. 7 - From the Data Bank choose a variable, find the...Ch. 7 - Repeat Exercise 1, using a different variable and...Ch. 7 - Repeat Exercise 1, using a proportion. For...Ch. 7 - From Data Set III in Appendix B, select a sample...Ch. 7 - From Data Set VI in Appendix B, select a sample of...Ch. 7 - Select a random sample of 20 of the record high...Ch. 7 - Determine whether each statement is true or false....Ch. 7 - Determine whether each statement is true or false....Ch. 7 - Determine whether each statement is true or false....Ch. 7 - Determine whether each statement is true or false....Ch. 7 - When a 99% confidence interval is calculated...Ch. 7 - The best point estimate of the population mean is...Ch. 7 - When the population standard deviation is unknown...Ch. 7 - Complete the following statements with the best...Ch. 7 - Complete the following statements with the best...Ch. 7 - Complete the following statements with the best...Ch. 7 - Complete the following statements with the best...Ch. 7 - Cost of Texts An irate student complained that the...Ch. 7 - Doctor Visit Costs An irate patient complained...Ch. 7 - Weights of Minivans The average weight of 40...Ch. 7 - Ages of Insurance Representatives In a study of 10...Ch. 7 - Prob. 16CQCh. 7 - Burglaries For a certain urban area, it was found...Ch. 7 - Hours Spent Studying A university dean wishes to...Ch. 7 - Prob. 19CQCh. 7 - Prob. 20CQCh. 7 - Prob. 21CQCh. 7 - Prob. 22CQCh. 7 - Prob. 23CQCh. 7 - Prob. 24CQCh. 7 - Prob. 25CQCh. 7 - Prob. 26CQCh. 7 - Critical Thinking Challenges A confidence interval...
Knowledge Booster


Learn more about
Need a deep-dive on the concept behind this application? Look no further. Learn more about this topic, statistics and related others by exploring similar questions and additional content below.Similar questions
- Name Harvard University California Institute of Technology Massachusetts Institute of Technology Stanford University Princeton University University of Cambridge University of Oxford University of California, Berkeley Imperial College London Yale University University of California, Los Angeles University of Chicago Johns Hopkins University Cornell University ETH Zurich University of Michigan University of Toronto Columbia University University of Pennsylvania Carnegie Mellon University University of Hong Kong University College London University of Washington Duke University Northwestern University University of Tokyo Georgia Institute of Technology Pohang University of Science and Technology University of California, Santa Barbara University of British Columbia University of North Carolina at Chapel Hill University of California, San Diego University of Illinois at Urbana-Champaign National University of Singapore…arrow_forwardA company found that the daily sales revenue of its flagship product follows a normal distribution with a mean of $4500 and a standard deviation of $450. The company defines a "high-sales day" that is, any day with sales exceeding $4800. please provide a step by step on how to get the answers in excel Q: What percentage of days can the company expect to have "high-sales days" or sales greater than $4800? Q: What is the sales revenue threshold for the bottom 10% of days? (please note that 10% refers to the probability/area under bell curve towards the lower tail of bell curve) Provide answers in the yellow cellsarrow_forwardFind the critical value for a left-tailed test using the F distribution with a 0.025, degrees of freedom in the numerator=12, and degrees of freedom in the denominator = 50. A portion of the table of critical values of the F-distribution is provided. Click the icon to view the partial table of critical values of the F-distribution. What is the critical value? (Round to two decimal places as needed.)arrow_forward
- A retail store manager claims that the average daily sales of the store are $1,500. You aim to test whether the actual average daily sales differ significantly from this claimed value. You can provide your answer by inserting a text box and the answer must include: Null hypothesis, Alternative hypothesis, Show answer (output table/summary table), and Conclusion based on the P value. Showing the calculation is a must. If calculation is missing,so please provide a step by step on the answers Numerical answers in the yellow cellsarrow_forwardShow all workarrow_forwardShow all workarrow_forward
arrow_back_ios
SEE MORE QUESTIONS
arrow_forward_ios
Recommended textbooks for you
 Glencoe Algebra 1, Student Edition, 9780079039897...AlgebraISBN:9780079039897Author:CarterPublisher:McGraw Hill
 Big Ideas Math A Bridge To Success Algebra 1: Stu...AlgebraISBN:9781680331141Author:HOUGHTON MIFFLIN HARCOURTPublisher:Houghton Mifflin Harcourt
 Holt Mcdougal Larson Pre-algebra: Student Edition...AlgebraISBN:9780547587776Author:HOLT MCDOUGALPublisher:HOLT MCDOUGAL
Glencoe Algebra 1, Student Edition, 9780079039897...
Algebra
ISBN:9780079039897
Author:Carter
Publisher:McGraw Hill
Big Ideas Math A Bridge To Success Algebra 1: Stu...
Algebra
ISBN:9781680331141
Author:HOUGHTON MIFFLIN HARCOURT
Publisher:Houghton Mifflin Harcourt
Holt Mcdougal Larson Pre-algebra: Student Edition...
Algebra
ISBN:9780547587776
Author:HOLT MCDOUGAL
Publisher:HOLT MCDOUGAL
Hypothesis Testing using Confidence Interval Approach; Author: BUM2413 Applied Statistics UMP;https://www.youtube.com/watch?v=Hq1l3e9pLyY;License: Standard YouTube License, CC-BY
Hypothesis Testing - Difference of Two Means - Student's -Distribution & Normal Distribution; Author: The Organic Chemistry Tutor;https://www.youtube.com/watch?v=UcZwyzwWU7o;License: Standard Youtube License