
Concept explainers
Videos
John can take either of two routes (A or B) to LAX airport. At midday on a typical Wednesday the travel time on either route is
a.
Find the better route for John to reach at the airport in 54 minutes to pick up his spouse.
Answer to Problem 91CE
The better route for John to reach at the airport in 54 minutes to pick up his spouse is route A.
Explanation of Solution
Calculation:
It is given that the time on route A follows normal distribution with mean of 54 minutes, standard deviation of 6 minutes and the time on route B follows normal distribution with mean of 60 minutes, standard deviation of 3 minutes.
Normal distribution:
A continuous random variable X is said to follow normal distribution if the probability density function of X is,
Assume that the random variable X denotes the time to reach airport.
For route A:
It is given that
Now, the probability to reach at the airport in 54 minutes using route A, implies that
Probability value:
Software procedure:
Step-by-step software procedure to obtain probability value using EXCEL is as follows:
- Open an EXCEL file.
- In cell A1, enter the formula “=NORM.DIST(54,54,6,1)”.
- Output using EXCEL software is given below:
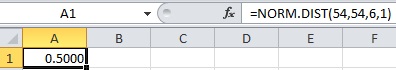
Therefore,
Thus, the probability to reach at the airport in 54 minutes using route A is 0.5.
For route B:
It is given that
Now, the probability to reach at the airport in 54 minutes using route B, implies that
Probability value:
Software procedure:
Step-by-step software procedure to obtain probability value using EXCEL is as follows:
- Open an EXCEL file.
- In cell A1, enter the formula “=NORM.DIST(54,60,3,1)”.
- Output using EXCEL software is given below:
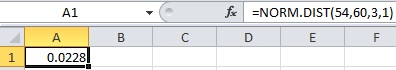
Therefore,
Thus, the probability to reach at the airport in 54 minutes using route B is 0.0228.
Therefore, there is more chance to reach airport by route A than by route B.
Thus, the better route for John to reach at the airport in 54 minutes to pick up his spouse is route A.
b.
Find the better route for John to reach at the airport in 66 minutes to pick up his spouse.
Answer to Problem 91CE
The better route for John to reach at the airport in 60 minutes to pick up his spouse is route A.
Explanation of Solution
Calculation:
For route A:
It is given that
Now, the probability to reach at the airport in 66 minutes using route A, implies that
Probability value:
Software procedure:
Step-by-step software procedure to obtain probability value using EXCEL is as follows:
- Open an EXCEL file.
- In cell A1, enter the formula “=NORM.DIST(60,54,6,1)”.
- Output using EXCEL software is given below:
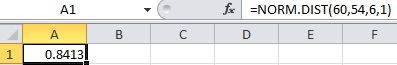
Therefore,
Thus, the probability to reach at the airport in 60 minutes using route A is 0.8413.
For route B:
It is given that
Now, the probability to reach at the airport in 60 minutes using route B, implies that
Probability value:
Software procedure:
Step-by-step software procedure to obtain probability value using EXCEL is as follows:
- Open an EXCEL file.
- In cell A1, enter the formula “=NORM.DIST(60,60,3,1)”.
- Output using EXCEL software is given below:
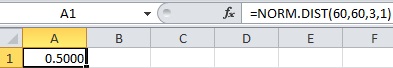
Therefore,
Thus, the probability to reach at the airport in 60 minutes using route B is 0.5.
Therefore, there is more chance to reach airport by route A than by route B.
Thus, the better route for John to reach at the airport in 60 minutes to pick up his spouse is route A.
c.
Find the better route for John to reach at the airport in 60 minutes to pick up his spouse.
Answer to Problem 91CE
The better route for John to reach at the airport in 66 minutes to pick up his spouse is route B.
Explanation of Solution
Calculation:
Coefficient of variation:
Coefficient of variation for a random variable X is defined as,
It is better to use a random variable with lower CV.
For route A:
It is given that
Now, the probability to reach at the airport in 66 minutes using route A, implies that
Probability value:
Software procedure:
Step-by-step software procedure to obtain probability value using EXCEL is as follows:
- Open an EXCEL file.
- In cell A1, enter the formula “=NORM.DIST(66,54,6,1)”.
- Output using EXCEL software is given below:
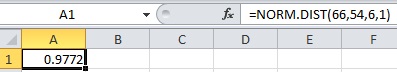
Therefore,
Thus, the probability to reach at the airport in 66 minutes using route A is 0.9972.
The CV for route A is,
For route B:
It is given that
Now, the probability to reach at the airport in 66 minutes using route B, implies that
Probability value:
Software procedure:
Step-by-step software procedure to obtain probability value using EXCEL is as follows:
- Open an EXCEL file.
- In cell A1, enter the formula “=NORM.DIST(66,60,3,1)”.
- Output using EXCEL software is given below:
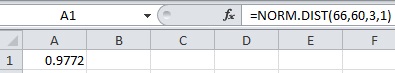
Therefore,
Thus, the probability to reach at the airport in 66 minutes using route B is 0.9972.
The CV for route B is,
Therefore, there is same chance to reach airport by route A and route B.
Now, the coefficient of variation for route B is less than route A.
Thus, the better route for John to reach at the airport in 66 minutes to pick up his spouse is route B.
Want to see more full solutions like this?
Chapter 7 Solutions
Loose-leaf For Applied Statistics In Business And Economics


- Examine the Variables: Carefully review and note the names of all variables in the dataset. Examples of these variables include: Mileage (mpg) Number of Cylinders (cyl) Displacement (disp) Horsepower (hp) Research: Google to understand these variables. Statistical Analysis: Select mpg variable, and perform the following statistical tests. Once you are done with these tests using mpg variable, repeat the same with hp Mean Median First Quartile (Q1) Second Quartile (Q2) Third Quartile (Q3) Fourth Quartile (Q4) 10th Percentile 70th Percentile Skewness Kurtosis Document Your Results: In RStudio: Before running each statistical test, provide a heading in the format shown at the bottom. “# Mean of mileage – Your name’s command” In Microsoft Word: Once you've completed all tests, take a screenshot of your results in RStudio and paste it into a Microsoft Word document. Make sure that snapshots are very clear. You will need multiple snapshots. Also transfer these results to the…arrow_forward2 (VaR and ES) Suppose X1 are independent. Prove that ~ Unif[-0.5, 0.5] and X2 VaRa (X1X2) < VaRa(X1) + VaRa (X2). ~ Unif[-0.5, 0.5]arrow_forward8 (Correlation and Diversification) Assume we have two stocks, A and B, show that a particular combination of the two stocks produce a risk-free portfolio when the correlation between the return of A and B is -1.arrow_forward
- 9 (Portfolio allocation) Suppose R₁ and R2 are returns of 2 assets and with expected return and variance respectively r₁ and 72 and variance-covariance σ2, 0%½ and σ12. Find −∞ ≤ w ≤ ∞ such that the portfolio wR₁ + (1 - w) R₂ has the smallest risk.arrow_forward7 (Multivariate random variable) Suppose X, €1, €2, €3 are IID N(0, 1) and Y2 Y₁ = 0.2 0.8X + €1, Y₂ = 0.3 +0.7X+ €2, Y3 = 0.2 + 0.9X + €3. = (In models like this, X is called the common factors of Y₁, Y₂, Y3.) Y = (Y1, Y2, Y3). (a) Find E(Y) and cov(Y). (b) What can you observe from cov(Y). Writearrow_forward1 (VaR and ES) Suppose X ~ f(x) with 1+x, if 0> x > −1 f(x) = 1−x if 1 x > 0 Find VaRo.05 (X) and ES0.05 (X).arrow_forward
- Joy is making Christmas gifts. She has 6 1/12 feet of yarn and will need 4 1/4 to complete our project. How much yarn will she have left over compute this solution in two different ways arrow_forwardSolve for X. Explain each step. 2^2x • 2^-4=8arrow_forwardOne hundred people were surveyed, and one question pertained to their educational background. The results of this question and their genders are given in the following table. Female (F) Male (F′) Total College degree (D) 30 20 50 No college degree (D′) 30 20 50 Total 60 40 100 If a person is selected at random from those surveyed, find the probability of each of the following events.1. The person is female or has a college degree. Answer: equation editor Equation Editor 2. The person is male or does not have a college degree. Answer: equation editor Equation Editor 3. The person is female or does not have a college degree.arrow_forward
 Algebra & Trigonometry with Analytic GeometryAlgebraISBN:9781133382119Author:SwokowskiPublisher:Cengage
 Functions and Change: A Modeling Approach to Coll...AlgebraISBN:9781337111348Author:Bruce Crauder, Benny Evans, Alan NoellPublisher:Cengage Learning
 Big Ideas Math A Bridge To Success Algebra 1: Stu...AlgebraISBN:9781680331141Author:HOUGHTON MIFFLIN HARCOURTPublisher:Houghton Mifflin Harcourt
 Algebra: Structure And Method, Book 1AlgebraISBN:9780395977224Author:Richard G. Brown, Mary P. Dolciani, Robert H. Sorgenfrey, William L. ColePublisher:McDougal Littell