Sugar-Sweetened Beverages In 2017, the journal Obesity reported on trends in sugar-sweetened beverage (SSB) consumption. A random sample of youths aged 12 to 19 years old were asked to monitor all food and beverages consumed in a 24-hour period. The study was done in 2003 and repeated in 2014. The numbers who consumed a sugary beverage such as soda or fruit juice in a day are shown in the table. (Bleich et al., “Trends in Beverage Consumption among Children and Adults, 2003-2014,” Obesity, vol. 26 [2018]: 432-441. doi:10.1002/oby.22056) a. Calculate and compare the percentages of youths in this age group who consumed an SSB during the recording period. b. Check that the conditions for using a two-population confidence interval hold. c. Find the 95 % confidence interval for the difference in the proportion of youth consuming an SSB in 2003 and 2014. Based on your confidence interval, do you think there has been a change in sugar-sweetened beverage consumption among this age group? Explain.
Sugar-Sweetened Beverages In 2017, the journal Obesity reported on trends in sugar-sweetened beverage (SSB) consumption. A random sample of youths aged 12 to 19 years old were asked to monitor all food and beverages consumed in a 24-hour period. The study was done in 2003 and repeated in 2014. The numbers who consumed a sugary beverage such as soda or fruit juice in a day are shown in the table. (Bleich et al., “Trends in Beverage Consumption among Children and Adults, 2003-2014,” Obesity, vol. 26 [2018]: 432-441. doi:10.1002/oby.22056) a. Calculate and compare the percentages of youths in this age group who consumed an SSB during the recording period. b. Check that the conditions for using a two-population confidence interval hold. c. Find the 95 % confidence interval for the difference in the proportion of youth consuming an SSB in 2003 and 2014. Based on your confidence interval, do you think there has been a change in sugar-sweetened beverage consumption among this age group? Explain.
Solution Summary: The author compares the required percentages of youth who consumed SSB in 2003 and 2014.
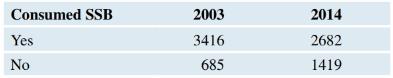
Sugar-Sweetened Beverages In 2017, the journal Obesity reported on trends in sugar-sweetened beverage (SSB) consumption. A random sample of youths aged 12 to 19 years old were asked to monitor all food and beverages consumed in a 24-hour period. The study was done in 2003 and repeated in 2014. The numbers who consumed a sugary beverage such as soda or fruit juice in a day are shown in the table. (Bleich et al., “Trends in Beverage Consumption among Children and Adults, 2003-2014,” Obesity, vol. 26 [2018]: 432-441. doi:10.1002/oby.22056)
a. Calculate and compare the percentages of youths in this age group who consumed an SSB during the recording period.
b. Check that the conditions for using a two-population confidence interval hold.
c. Find the
95
%
confidence interval for the difference in the proportion of youth consuming an SSB in 2003 and 2014. Based on your confidence interval, do you think there has been a change in sugar-sweetened beverage consumption among this age group? Explain.
Finite Mathematics for Business, Economics, Life Sciences and Social Sciences
Knowledge Booster
Learn more about
Need a deep-dive on the concept behind this application? Look no further. Learn more about this topic, statistics and related others by exploring similar questions and additional content below.
Correlation Vs Regression: Difference Between them with definition & Comparison Chart; Author: Key Differences;https://www.youtube.com/watch?v=Ou2QGSJVd0U;License: Standard YouTube License, CC-BY
Correlation and Regression: Concepts with Illustrative examples; Author: LEARN & APPLY : Lean and Six Sigma;https://www.youtube.com/watch?v=xTpHD5WLuoA;License: Standard YouTube License, CC-BY


 Glencoe Algebra 1, Student Edition, 9780079039897...AlgebraISBN:9780079039897Author:CarterPublisher:McGraw Hill
 Big Ideas Math A Bridge To Success Algebra 1: Stu...AlgebraISBN:9781680331141Author:HOUGHTON MIFFLIN HARCOURTPublisher:Houghton Mifflin Harcourt
 Holt Mcdougal Larson Pre-algebra: Student Edition...AlgebraISBN:9780547587776Author:HOLT MCDOUGALPublisher:HOLT MCDOUGAL
 Functions and Change: A Modeling Approach to Coll...AlgebraISBN:9781337111348Author:Bruce Crauder, Benny Evans, Alan NoellPublisher:Cengage Learning
 College Algebra (MindTap Course List)AlgebraISBN:9781305652231Author:R. David Gustafson, Jeff HughesPublisher:Cengage Learning