
EP ORGANIC CHEMISTRY-OWL V2 ACCESS
8th Edition
ISBN: 9781305582453
Author: Brown
Publisher: Cengage Learning
expand_more
expand_more
format_list_bulleted
Concept explainers
Videos
Textbook Question
Chapter 7, Problem 7.33P
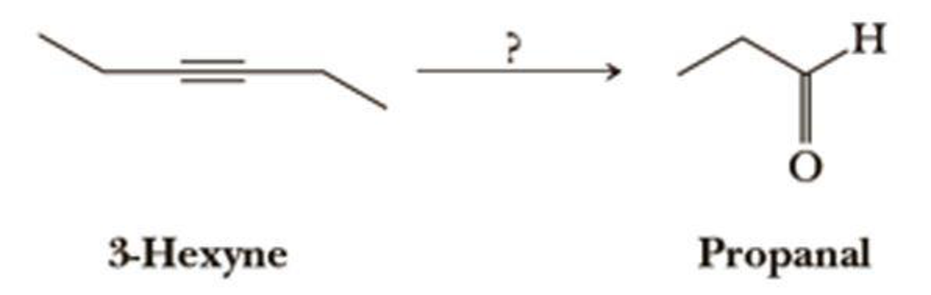
Using your reaction roadmap as a guide, show how to convert 3-hexyne into propanal. All of the carbon atoms of the target molecule must be derived from the starting material as efficiently as possible. Show all intermediate molecules synthesized along the way.
Expert Solution & Answer

Trending nowThis is a popular solution!

Students have asked these similar questions
The temperature on a sample of pure X held at 1.25 atm and -54. °C is increased until the sample boils. The temperature is then held constant and the
pressure is decreased by 0.42 atm. On the phase diagram below draw a path that shows this set of changes.
pressure (atm)
2
0
0
200
400
temperature (K)
X
QUESTION: Answer Question 5: 'Calculating standard error of regression' STEP 1 by filling in all the empty green boxes
*The values are all provided in the photo attached*
pressure (atm)
3
The pressure on a sample of pure X held at 47. °C and 0.88 atm is increased until the sample condenses. The pressure is then held constant and the
temperature is decreased by 82. °C. On the phase diagram below draw a path that shows this set of changes.
0
0
200
temperature (K)
400
а
Chapter 7 Solutions
EP ORGANIC CHEMISTRY-OWL V2 ACCESS
Ch. 7.2 - Write the IUPAC name of each compound.Ch. 7.2 - Write the common name of each alkyne.Ch. 7.5 - Prob. 7.3PCh. 7.7 - Draw a structural formula for a hydrocarbon with...Ch. 7.7 - Hydration of 2-pentyne gives a mixture of two...Ch. 7.9 - Prob. 7.6PCh. 7 - Prob. 7.7PCh. 7 - Show how to prepare each alkyne from the given...Ch. 7 - Prob. 7.9PCh. 7 - Complete each acid-base reaction and predict...
Ch. 7 - Draw structural formulas for the major product(s)...Ch. 7 - Draw the structural formula of the enol formed in...Ch. 7 - Prob. 7.13PCh. 7 - Prob. 7.14PCh. 7 - Prob. 7.15PCh. 7 - Show reagents and experimental conditions you...Ch. 7 - Show reagents and experimental conditions you...Ch. 7 - Show how to convert 1-butyne to each of these...Ch. 7 - Prob. 7.19PCh. 7 - Show reagents and experimental conditions to bring...Ch. 7 - Show reagents to bring about each conversion.Ch. 7 - Propose a synthesis for (Z)-9-tricosene...Ch. 7 - Propose a synthesis of each compound starting from...Ch. 7 - Show how to prepare each compound from 1-heptene....Ch. 7 - Prob. 7.25PCh. 7 - Prob. 7.26PCh. 7 - Following is the structural formula of the...Ch. 7 - The standard procedure for synthesizing a compound...Ch. 7 - Prob. 7.29PCh. 7 - Prob. 7.30PCh. 7 - Using your reaction roadmap as a guide, show how...Ch. 7 - Using your reaction roadmap as a guide, show how...Ch. 7 - Using your reaction roadmap as a guide, show how...Ch. 7 - Using your reaction roadmap as a guide, show how...Ch. 7 - Prob. 7.35P
Knowledge Booster


Learn more about
Need a deep-dive on the concept behind this application? Look no further. Learn more about this topic, chemistry and related others by exploring similar questions and additional content below.Similar questions
- er your payment details | bar xb Home | bartleby x + aleksogi/x/isl.exe/1o u-lgNskr7j8P3jH-1Qs_pBanHhviTCeeBZbufuBYT0Hz7m7D3ZcW81NC1d8Kzb4srFik1OUFhKMUXzhGpw7k1 O States of Matter Sketching a described thermodynamic change on a phase diagram 0/5 The pressure on a sample of pure X held at 47. °C and 0.88 atm is increased until the sample condenses. The pressure is then held constant and the temperature is decreased by 82. °C. On the phase diagram below draw a path that shows this set of changes. pressure (atm) 1 3- 0- 0 200 Explanation Check temperature (K) 400 X Q Search L G 2025 McGraw Hill LLC. All Rights Reserved Terms of Use Privacy Cearrow_forward5.arrow_forward6.arrow_forward
- 0/5 alekscgi/x/sl.exe/1o_u-IgNglkr7j8P3jH-IQs_pBaHhvlTCeeBZbufuBYTi0Hz7m7D3ZcSLEFovsXaorzoFtUs | AbtAURtkqzol 1HRAS286, O States of Matter Sketching a described thermodynamic change on a phase diagram The pressure on a sample of pure X held at 47. °C and 0.88 atm is increased until the sample condenses. The pressure is then held constant and the temperature is decreased by 82. °C. On the phase diagram below draw a path that shows this set of changes. 3 pressure (atm) + 0- 0 5+ 200 temperature (K) 400 Explanation Check X 0+ F3 F4 F5 F6 F7 S 2025 McGraw Hill LLC All Rights Reserved. Terms of Use Privacy Center Accessibility Q Search LUCR + F8 F9 F10 F11 F12 * % & ( 5 6 7 8 9 Y'S Dele Insert PrtSc + Backsarrow_forward5.arrow_forward9arrow_forward
- alekscgi/x/lsl.exe/1o_u-IgNslkr7j8P3jH-IQs_pBanHhvlTCeeBZbufu BYTI0Hz7m7D3ZS18w-nDB10538ZsAtmorZoFusYj2Xu9b78gZo- O States of Matter Sketching a described thermodynamic change on a phase diagram 0/5 The pressure on a sample of pure X held at 47. °C and 0.88 atm is increased until the sample condenses. The pressure is then held constant and the temperature is decreased by 82. °C. On the phase diagram below draw a path that shows this set of changes. pressure (atm) 3- 200 temperature (K) Explanation Chick Q Sowncharrow_forward0+ aleksog/x/lsl.exe/1ou-lgNgkr7j8P3H-IQs pBaHhviTCeeBZbufuBYTOHz7m7D3ZStEPTBSB3u9bsp3Da pl19qomOXLhvWbH9wmXW5zm O States of Matter Sketching a described thermodynamic change on a phase diagram 0/5 Gab The temperature on a sample of pure X held at 0.75 atm and -229. °C is increased until the sample sublimes. The temperature is then held constant and the pressure is decreased by 0.50 atm. On the phase diagram below draw a path that shows this set of changes. F3 pressure (atm) 0- 0 200 Explanation temperature (K) Check F4 F5 ☀+ Q Search Chill Will an 9 ENG F6 F7 F8 F9 8 Delete F10 F11 F12 Insert PrtSc 114 d Ararrow_forwardx + LEKS: Using a phase diagram a X n/alekscgi/x/lsl.exe/10_u-IgNsikr7j8P3jH-IQs_pBan HhvlTCeeBZbufu BYTI0Hz7m7D3ZcHYUt80XL-5alyVpw ○ States of Matter Using a phase diagram to find a phase transition temperature or pressure Use the phase diagram of Substance X below to find the melting point of X when the pressure above the solid is 1.1 atm. pressure (atm) 16 08- solid liquid- 0 200 400 gas 600 temperature (K) Note: your answer must be within 25 °C of the exact answer to be graded correct. × 5arrow_forward
- S: Using a phase diagram leksogi/x/sl.exe/1ou-IgNs kr 7j8P3jH-IQs_pBan HhvTCeeBZbufuBYTI0Hz7m7D3ZdHYU+80XL-5alyVp O States of Matter Using a phase diagram to find a phase transition temperature or pressure se the phase diagram of Substance X below to find the boiling point of X when the pressure on the liquid is 1.6 atm. pressure (atm) 32- 16- solid liquid 0. gas 100 200 temperature (K) 300 Note: your answer must be within 12.5 °C of the exact answer to be graded correct. 10 Explanation Check § Q Search J 2025 McGraw Hill LLC. All Rights Researrow_forward151.2 254.8 85.9 199.6 241.4 87.6 242.5 186.4 155.8 257.1 242.9 253.3 256.0 216.6 108.7 239.0 149.7 236.4 152.1 222.7 148.7 278.2 268.7 234.4 262.7 283.2 143.6 QUESTION: Using this group of data on salt reduced tomato sauce concentration readings answer the following questions: 1. 95% Cl Confidence Interval (mmol/L) 2. [Na+] (mg/100 mL) 3. 95% Na+ Confidence Interval (mg/100 mL)arrow_forwardResults Search Results Best Free Coursehero Unloc xb Success Confirmation of Q x O Google Pas alekscgi/x/lsl.exe/1o_u-IgNslkr 7j8P3jH-IQs_pBanHhvlTCeeBZbufu BYTI0Hz7m7D3ZcHYUt80XL-5alyVpwDXM TEZayFYCavJ17dZtpxbFD0Qggd1J O States of Matter Using a phase diagram to find a phase transition temperature or pressure Gabr 3/5 he pressure above a pure sample of solid Substance X at 101. °C is lowered. At what pressure will the sample sublime? Use the phase diagram of X below to nd your answer. pressure (atm) 24- 12 solid liquid gas 200 400 temperature (K) 600 ote: your answer must be within 0.15 atm of the exact answer to be graded correct. atm Thanation Check © 2025 McGraw Hill LLC. All Rights Reserved. Terms of Use | Privacy Center I Q Search L³ ملةarrow_forward
arrow_back_ios
SEE MORE QUESTIONS
arrow_forward_ios
Recommended textbooks for you
 Organic ChemistryChemistryISBN:9781305580350Author:William H. Brown, Brent L. Iverson, Eric Anslyn, Christopher S. FootePublisher:Cengage Learning
 Chemistry for Today: General, Organic, and Bioche...ChemistryISBN:9781305960060Author:Spencer L. Seager, Michael R. Slabaugh, Maren S. HansenPublisher:Cengage Learning
Organic Chemistry
Chemistry
ISBN:9781305580350
Author:William H. Brown, Brent L. Iverson, Eric Anslyn, Christopher S. Foote
Publisher:Cengage Learning
Chemistry for Today: General, Organic, and Bioche...
Chemistry
ISBN:9781305960060
Author:Spencer L. Seager, Michael R. Slabaugh, Maren S. Hansen
Publisher:Cengage Learning
Lipids - Fatty Acids, Triglycerides, Phospholipids, Terpenes, Waxes, Eicosanoids; Author: The Organic Chemistry Tutor;https://www.youtube.com/watch?v=7dmoH5dAvpY;License: Standard YouTube License, CC-BY