
Videos
Evaluating the Income Statement and Income Tax Effects of Lower of Cost or Market
Smart Company prepared its annual financial statements dated December 31. The company used the FIFO inventory costing method, but it failed to apply LCM to the ending inventory. The preliminary income statement follows:
| Sales Revenue | $280,000 | |
| Cost of Goods Sold | ||
| Beginning Inventory | $30,000 | |
| Purchases | 182,000 | |
| Goods Available for Sale | 212,000 | |
| Ending Inventory (FIFO cost) | 44,000 | |
| Cost of Goods Sold | 168,000 | |
| Gross Profit | 112,000 | |
| Operating Expenses | 61,000 | |
| Income from Operations | 51,000 | |
| Income Tax Expense (30%) | 15,300 | |
| Net Income | $35,700 |
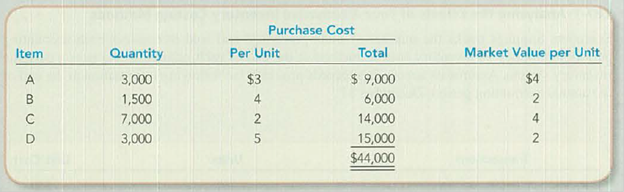
Assume that you have been asked to restate the financial statements to incorporate LCM. You have developed the following data relating to the ending inventory:
TIP: Inventory write-downs do not affect the cost of goods available for sale. Instead, the effect of the write-down is to reduce ending inventory, which increases Cost of Goods Sold and then affects other amounts reported lower in the income statement.
Required:
- 1. Restate the income statement to reflect LCM valuation of the ending inventory. Apply LCM on an item-by-item basis and show computations.
- 2. Compare and explain the LCM effect on each amount that was changed in requirement 1.
Want to see the full answer?
Check out a sample textbook solution
Chapter 7 Solutions
Connect 1 Semester Access Card for Fundamentals of Financial Accounting


- Please given correct answer for General accounting question I need step by step explanationarrow_forwardBased on the results of the Sales Total vs Sales Order Counts by Channel in 2022 visualization, how do the sales channels compare with each other? a. Website sales had the lowest number of sales orders, and the average value of the sales orders was lower compared to the other sales channels. b. B2B sales had the highest number of sales orders, and the average value of the sales orders was lower compared to the other sales channels. c. Storefront sales had the highest number of sales orders, and the average value of the sales orders was lower compared to the other sales channels. d. Storefront sales had the highest number of sales orders, and the average value of the sales orders was higher compared to the other sales channels.arrow_forwardPlease explain this financial accounting problem by applying valid financial principles.arrow_forward
- I want to this question answer for Financial accounting question not need ai solutionarrow_forwardI need help with this financial accounting question using accurate methods and procedures.arrow_forwardUsing the Sales Total vs Sales Order Counts by Channel in 2022 visualization, what trends are shown for the B2B sales channel? What recommendations do you have for management for the B2B strategy? What are some considerations when pursuing a B2B strategy?arrow_forward
- Can you provide a detailed solution to this financial accounting problem using proper principles?arrow_forwardUsing the results of the Top 5 Customers by Accounts Receivable Amount Due and the Top 5 Customers by Outstanding Sales Order Amount visualization, what conclusion can be made regarding the outstanding sales orders? a. The high value of outstanding accounts receivable for Sanders Corp may be directly related to their high value of outstanding sales orders. b. The high value of outstanding accounts receivable for Williams Corp may be directly related to their high value of outstanding sales orders. c. The high value of outstanding sales orders for Roberts Corp has caused them not to pay a large value of invoices. d. Evans Corp has a high value of outstanding accounts receivable and outstanding sales orders.arrow_forwardBased on the dashboard, what recommendations would you give to improve the overall sales and revenue of Borders USA? Is there any additional information would you like to have to provide useful recommendations? What are your interpretations of AR Aging and Sales Order Aging dashboards?arrow_forward
- 1. Using the Sales vs Revenue by Quarter in 2022 visualization, what trends are being shown between sales and revenue? a. Sales was variable for each quarter, but revenue decreased every quarter. b. Sales decreased every quarter, but revenue was variable for each quarter. c. Revenue was higher than sales for each quarter. d. Revenue was lower than sales for only the first two quarters.arrow_forwardI need help with this financial accounting problem using accurate calculation methods.arrow_forwardCan you provide the valid approach to solving this financial accounting question with suitable standards?arrow_forward
 College Accounting, Chapters 1-27AccountingISBN:9781337794756Author:HEINTZ, James A.Publisher:Cengage Learning,
 Principles of Accounting Volume 1AccountingISBN:9781947172685Author:OpenStaxPublisher:OpenStax College
 Financial Accounting: The Impact on Decision Make...AccountingISBN:9781305654174Author:Gary A. Porter, Curtis L. NortonPublisher:Cengage Learning
 Financial AccountingAccountingISBN:9781337272124Author:Carl Warren, James M. Reeve, Jonathan DuchacPublisher:Cengage Learning
 Financial And Managerial AccountingAccountingISBN:9781337902663Author:WARREN, Carl S.Publisher:Cengage Learning,