
Concept explainers
Videos
What is a wave? Explain the following terms associated with waves: wavelength, frequency, amplitude.
Interpretation:
The terms wave, wavelength, frequency and amplitude should be explained with a neat diagram.
Concept Introduction:
A wave is a disturbance or variation that travels through a medium transporting energy without transporting matter.
The wavelength is the distance between identical points on successive waves.
The frequency is the number of waves that pass through any particular point in one second.
The amplitude is the vertical distance from the midline of a wave to the top of the peak or the bottom of the trough.
Explanation of Solution
The wave can be in any forms which are shown in the below diagram.
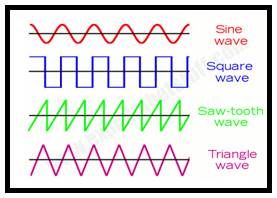
Figure.1
The wavelength is the distance between identical points on successive waves which are shown both in high and low frequency waves.
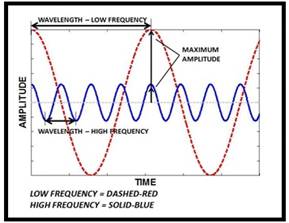
Figure.2
The frequency is the number of waves that pass through any particular point labelled as
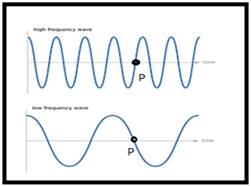
Figure.3
The amplitude is the vertical distance from the midline of a wave to the top of the peak or the bottom of the trough which is clearly shown in left side of figure4 diagram. In the right side diagram, both high and low amplitude waves are shown.
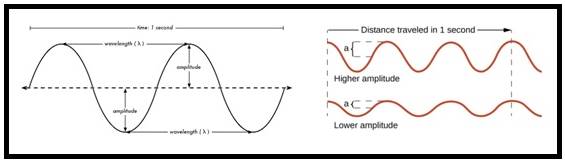
Figure.4
The terms wave, wavelength, frequency and amplitude are explained with a neat diagram.
Want to see more full solutions like this?
Chapter 7 Solutions
AVC LOOSELEAF CHEMISTRY W/CONNECT 2 SEM
Additional Science Textbook Solutions
Biological Science (6th Edition)
College Physics: A Strategic Approach (3rd Edition)
Concepts of Genetics (12th Edition)
Chemistry: Structure and Properties (2nd Edition)
Organic Chemistry (8th Edition)
Genetic Analysis: An Integrated Approach (3rd Edition)


- 5.arrow_forward6.arrow_forward0/5 alekscgi/x/sl.exe/1o_u-IgNglkr7j8P3jH-IQs_pBaHhvlTCeeBZbufuBYTi0Hz7m7D3ZcSLEFovsXaorzoFtUs | AbtAURtkqzol 1HRAS286, O States of Matter Sketching a described thermodynamic change on a phase diagram The pressure on a sample of pure X held at 47. °C and 0.88 atm is increased until the sample condenses. The pressure is then held constant and the temperature is decreased by 82. °C. On the phase diagram below draw a path that shows this set of changes. 3 pressure (atm) + 0- 0 5+ 200 temperature (K) 400 Explanation Check X 0+ F3 F4 F5 F6 F7 S 2025 McGraw Hill LLC All Rights Reserved. Terms of Use Privacy Center Accessibility Q Search LUCR + F8 F9 F10 F11 F12 * % & ( 5 6 7 8 9 Y'S Dele Insert PrtSc + Backsarrow_forward
- 5.arrow_forward9arrow_forwardalekscgi/x/lsl.exe/1o_u-IgNslkr7j8P3jH-IQs_pBanHhvlTCeeBZbufu BYTI0Hz7m7D3ZS18w-nDB10538ZsAtmorZoFusYj2Xu9b78gZo- O States of Matter Sketching a described thermodynamic change on a phase diagram 0/5 The pressure on a sample of pure X held at 47. °C and 0.88 atm is increased until the sample condenses. The pressure is then held constant and the temperature is decreased by 82. °C. On the phase diagram below draw a path that shows this set of changes. pressure (atm) 3- 200 temperature (K) Explanation Chick Q Sowncharrow_forward
- 0+ aleksog/x/lsl.exe/1ou-lgNgkr7j8P3H-IQs pBaHhviTCeeBZbufuBYTOHz7m7D3ZStEPTBSB3u9bsp3Da pl19qomOXLhvWbH9wmXW5zm O States of Matter Sketching a described thermodynamic change on a phase diagram 0/5 Gab The temperature on a sample of pure X held at 0.75 atm and -229. °C is increased until the sample sublimes. The temperature is then held constant and the pressure is decreased by 0.50 atm. On the phase diagram below draw a path that shows this set of changes. F3 pressure (atm) 0- 0 200 Explanation temperature (K) Check F4 F5 ☀+ Q Search Chill Will an 9 ENG F6 F7 F8 F9 8 Delete F10 F11 F12 Insert PrtSc 114 d Ararrow_forwardx + LEKS: Using a phase diagram a X n/alekscgi/x/lsl.exe/10_u-IgNsikr7j8P3jH-IQs_pBan HhvlTCeeBZbufu BYTI0Hz7m7D3ZcHYUt80XL-5alyVpw ○ States of Matter Using a phase diagram to find a phase transition temperature or pressure Use the phase diagram of Substance X below to find the melting point of X when the pressure above the solid is 1.1 atm. pressure (atm) 16 08- solid liquid- 0 200 400 gas 600 temperature (K) Note: your answer must be within 25 °C of the exact answer to be graded correct. × 5arrow_forwardS: Using a phase diagram leksogi/x/sl.exe/1ou-IgNs kr 7j8P3jH-IQs_pBan HhvTCeeBZbufuBYTI0Hz7m7D3ZdHYU+80XL-5alyVp O States of Matter Using a phase diagram to find a phase transition temperature or pressure se the phase diagram of Substance X below to find the boiling point of X when the pressure on the liquid is 1.6 atm. pressure (atm) 32- 16- solid liquid 0. gas 100 200 temperature (K) 300 Note: your answer must be within 12.5 °C of the exact answer to be graded correct. 10 Explanation Check § Q Search J 2025 McGraw Hill LLC. All Rights Researrow_forward
- 151.2 254.8 85.9 199.6 241.4 87.6 242.5 186.4 155.8 257.1 242.9 253.3 256.0 216.6 108.7 239.0 149.7 236.4 152.1 222.7 148.7 278.2 268.7 234.4 262.7 283.2 143.6 QUESTION: Using this group of data on salt reduced tomato sauce concentration readings answer the following questions: 1. 95% Cl Confidence Interval (mmol/L) 2. [Na+] (mg/100 mL) 3. 95% Na+ Confidence Interval (mg/100 mL)arrow_forwardResults Search Results Best Free Coursehero Unloc xb Success Confirmation of Q x O Google Pas alekscgi/x/lsl.exe/1o_u-IgNslkr 7j8P3jH-IQs_pBanHhvlTCeeBZbufu BYTI0Hz7m7D3ZcHYUt80XL-5alyVpwDXM TEZayFYCavJ17dZtpxbFD0Qggd1J O States of Matter Using a phase diagram to find a phase transition temperature or pressure Gabr 3/5 he pressure above a pure sample of solid Substance X at 101. °C is lowered. At what pressure will the sample sublime? Use the phase diagram of X below to nd your answer. pressure (atm) 24- 12 solid liquid gas 200 400 temperature (K) 600 ote: your answer must be within 0.15 atm of the exact answer to be graded correct. atm Thanation Check © 2025 McGraw Hill LLC. All Rights Reserved. Terms of Use | Privacy Center I Q Search L³ ملةarrow_forward301.7 348.9 193.7 308.6 339.5 160.6 337.7 464.7 223.5 370.5 326.6 327.5 336.1 317.9 203.8 329.8 221.9 331.7 211.7 309.6 223.4 353.7 334.6 305.6 340.0 304.3 244.7 QUESTION: Using this group of data on regular tomato sauce concentration readings answer the following questions: 1. 95% Cl Confidence Interval (mmol/L) 2. [Na+] (mg/100 mL) 3. 95% Na+ Confidence Interval (mg/100 mL)arrow_forward
 Introductory Chemistry: An Active Learning Approa...ChemistryISBN:9781305079250Author:Mark S. Cracolice, Ed PetersPublisher:Cengage Learning
 Chemistry for Engineering StudentsChemistryISBN:9781337398909Author:Lawrence S. Brown, Tom HolmePublisher:Cengage Learning
 Chemistry: Matter and ChangeChemistryISBN:9780078746376Author:Dinah Zike, Laurel Dingrando, Nicholas Hainen, Cheryl WistromPublisher:Glencoe/McGraw-Hill School Pub Co
 World of Chemistry, 3rd editionChemistryISBN:9781133109655Author:Steven S. Zumdahl, Susan L. Zumdahl, Donald J. DeCostePublisher:Brooks / Cole / Cengage Learning
 Chemistry for Engineering StudentsChemistryISBN:9781285199023Author:Lawrence S. Brown, Tom HolmePublisher:Cengage Learning