- (a) Revisit Example 7-1. What is the error in assuming the concentration of species B is constant and what limits can you put on the calculated value of k? (I.e., k = 0.24 ±?)
- (b) Revisit Example 7-3. Explain why the regression was carried out twice to find k′ and k.
- (c) Revisit Example 7-4. Regress the data to lit the rate law
What is the difference in the correlation and sums of squares compared with those given in Example 7-4? Why was it necessary to regress the data twice, once to obtain Table E7-4.3 and once to obtain Table E7-4.4?
(a)
Interpretation:
The error in assuming the concentration of species B is constant and the limits that can be put over the calculated value of
Concept introduction:
The integral method is the quickest method to use to determine the rate law if the order turns out to zero, first, or second order. In the integral method, we guess the reaction order, α, in the combined batch reactor mole balance and rate law equation.
Integrate the differential equation to obtain the concentration as a function of time. If the order we assume is correct, the appropriate plot of the concentration-time data should be linear. The integral method is used most often when the reaction order is known and it is desired to evaluate the specific reaction rate constant at different temperatures to determine the activation energy.
Answer to Problem 7.1P
The error in assuming the concentration of species B is constant and the limits that can be put over the calculated value of
Explanation of Solution
The given liquid phase reaction which takes place in a batch reactor is as follows.
The initial concentration of Trityl (A) in the feed is
The initial concentration of methanol (B) in the feed is
The temperature of the batch reactor is
The data for time and various concentration of A is given in the table below.
The rate law for the above mentioned reaction is given below.
Where,
The value of
Where,
Substitute
The value of
Substitute
So, the differential rate equation for the equation is given below.
The integration of the above equation with appropriate limits is given below and Substitute
If
Thus, the value of conversion,
| 0 | |||||||
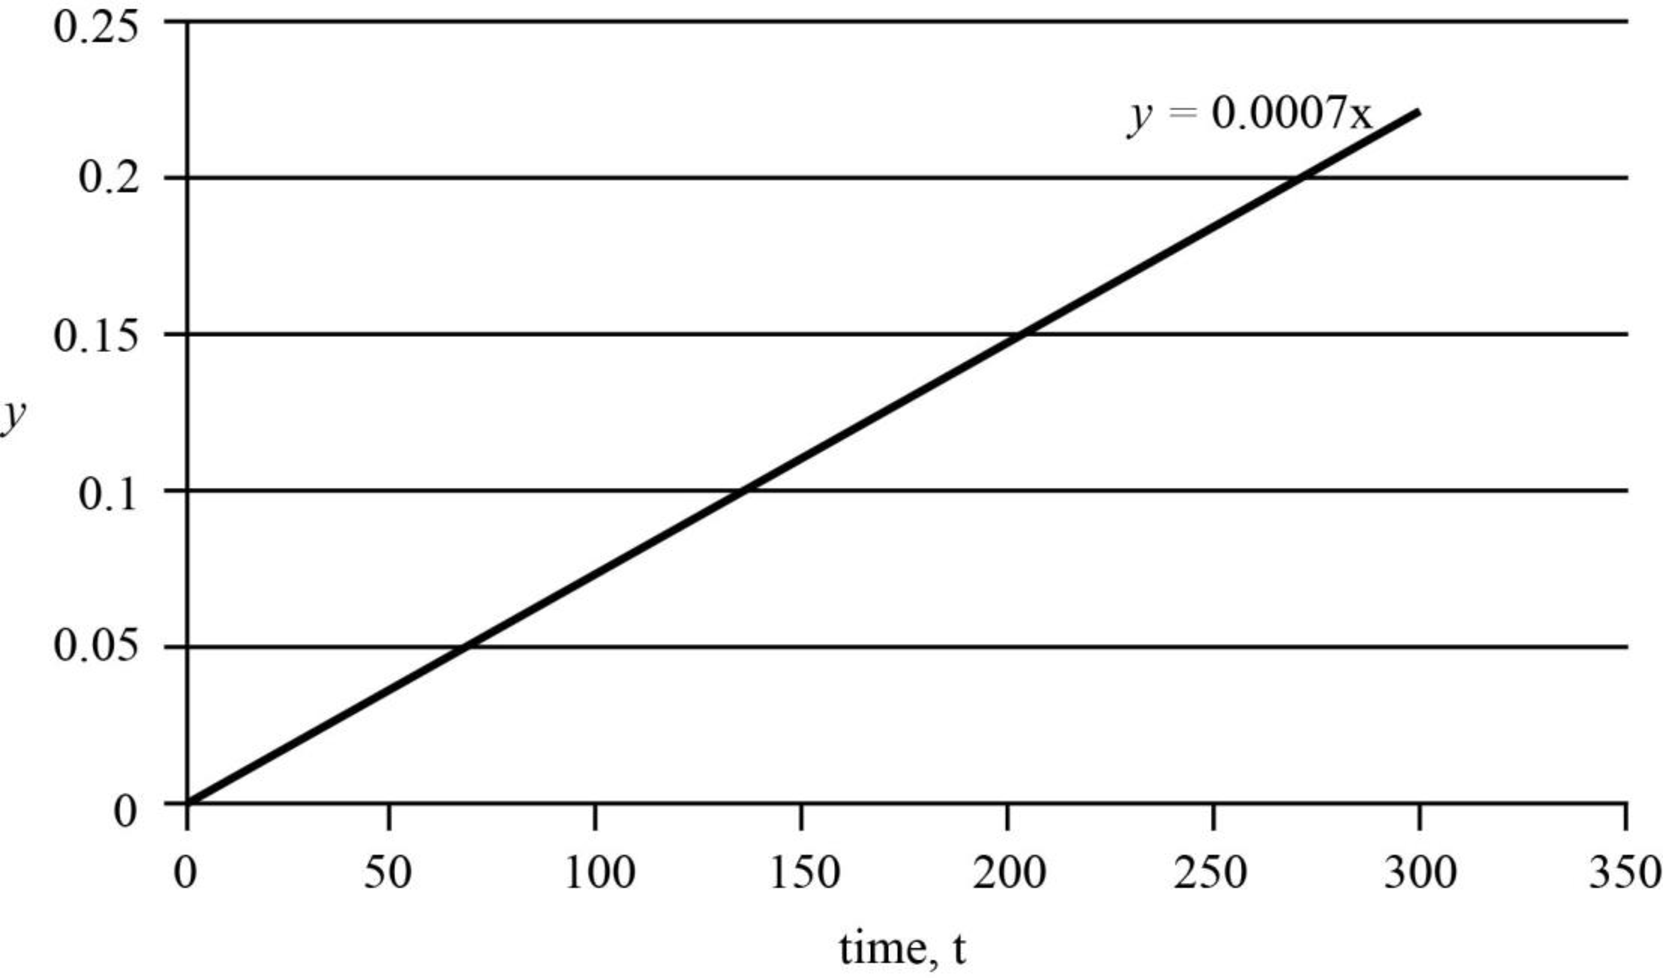
Thus, the graph that can be plotted between

Figure 1
The intercept,
The actual value of
(b)
Interpretation:
The reason as to why regression is carried out twice to find
Concept Introduction:
In nonlinear regression analysis, we search for those parameter values that minimize the sum of the squares of the differences between the measured values and the calculated values for all the data points.
The initial estimates of the parameter values (e.g., reaction order, specific rate constant) in order to calculate the concentration for each data point,
Explanation of Solution
After the first regression, the equation order is predicted
Thus, the value of rate constant can only be calculated at
(c)
Interpretation:
The difference between correlation and sums of square compared with values in the given example is to be stated. The reason as to why regression is carried out twice is to be stated.
Concept Introduction:
In nonlinear regression analysis, we search for those parameter values that minimize the sum of the squares of the differences between the measured values and the calculated values for all the data points.
The initial estimates of the parameter values (e.g., reaction order, specific rate constant) in order to calculate the concentration for each data point,
Explanation of Solution
The given rate law is as follows.
During the first regression, the equation order is predicted as an integer and the corresponding rate constant is also integer. So, the regression is proceeded at the order of
Want to see more full solutions like this?
Chapter 7 Solutions
Elements of Chemical Reaction Engineering (5th Edition) (Prentice Hall International Series in the Physical and Chemical Engineering Sciences)
Additional Engineering Textbook Solutions
Thermodynamics: An Engineering Approach
Starting Out With Visual Basic (8th Edition)
Starting Out with C++ from Control Structures to Objects (9th Edition)
Starting Out with Java: From Control Structures through Data Structures (4th Edition) (What's New in Computer Science)
Computer Science: An Overview (13th Edition) (What's New in Computer Science)
Starting Out with Python (4th Edition)
- The power out of an adiabatic steam turbine is 5 MW and the steam enters turbine at 2 MPa and velocity of 50 m/s, specific enthalpy (h) of 3248 kJ/kg. The elevation of the inlet is 10 m higher than at the datum. The vapor mixture exits at 15 kPa and a velocity of 180 m/s, specific enthalpy (h) of 2361.01 kJ/kg. The elevation of the exit is 6 m higher than at the datum. Let g = 9.81 m/s². Assuming the ideal gas model and R = 0.462 KJ/(kg.K). The steam specific heat ratio is 1.283. Calculate:arrow_forwardstep by step pleasearrow_forwardstep by step pleasearrow_forward
- step by steparrow_forwardThe power out of an adiabatic steam turbine is 5 MW and the steam enters turbine at 2 MPa and velocity of 50 m/s, specific enthalpy (h) of 3248 kJ/kg. The elevation of the inlet is 10 m higher than at the datum. The vapor mixture exits at 15 kPa and a velocity of 180 m/s, specific enthalpy (h) of 2361.01 kJ/kg. The elevation of the exit is 6 m higher than at the datum. Let g = 9.81 m/s². Assuming the ideal gas model and R = 0.462 KJ/(kg.K). The steam specific heat ratio is 1.283. Calculate:arrow_forwardThe power out of an adiabatic steam turbine is 5 MW and the steam enters turbine at 2 MPa and velocity of 50 m/s, specific enthalpy (h) of 3248 kJ/kg. The elevation of the inlet is 10 m higher than at the datum. The vapor mixture exits at 15 kPa and a velocity of 180 m/s, specific enthalpy (h) of 2361.01 kJ/kg. The elevation of the exit is 6 m higher than at the datum. Let g = 9.81 m/s². Assuming the ideal gas model and R = 0.462 KJ/(kg.K). The steam specific heat ratio is 1.283. Calculate:arrow_forward
- O Consider a 0.8 m high and 0.5 m wide window with thickness of 8 mm and thermal conductivity of k = 0.78 W/m °C. For dry day, the temperature of outdoor is -10 °C and the inner room temperature is 20°C. Take the heat transfer coefficient on the inner and outer surface of the window to be h₁ = 10 W/m² °C and h₂ = 40 W/m² °C which includes the effects of insulation. Determine:arrow_forwardCalculate the mass flow rate of the steam. Determine Cp and C₁ of steam.arrow_forwardstep by step pleasearrow_forward
- step by steparrow_forward4. Show that the fraction, F, of the energy released from a supercritical chain reaction that originates in the final m generations of the chain is given approximately by F= 1 km provided the total number of generations is large.arrow_forwardPLEASE SOLVE STEP BY STEP WITHOUT ARTIFICIAL INTELLIGENCE OR CHATGPT I don't understand why you use chatgpt, if I wanted to I would do it myself, I need to learn from you, not from being a d amn robot. SOLVE BY HAND STEP BY STEP A solution containing 7.5% sulfuric acid by weight at 70 °F is concentrated to 45% by weight by evaporating water. The concentrated solution and the water vapor exit the evaporator at 170 °F and 1 atm. Calculate the rate at which heat must be transferred to the evaporator to process 1500 lbm/hr of the feed solution to the evaporator. It is recommended to use the enthalpy-concentration diagram for sulfuric acid from Chapter 8 of Felder's book or an enthalpy-concentration diagram for sulfuric acid found in another unit operations book or chemical engineering manual such as Perry's.arrow_forward
 Introduction to Chemical Engineering Thermodynami...Chemical EngineeringISBN:9781259696527Author:J.M. Smith Termodinamica en ingenieria quimica, Hendrick C Van Ness, Michael Abbott, Mark SwihartPublisher:McGraw-Hill Education
 Elementary Principles of Chemical Processes, Bind...Chemical EngineeringISBN:9781118431221Author:Richard M. Felder, Ronald W. Rousseau, Lisa G. BullardPublisher:WILEY
 Elements of Chemical Reaction Engineering (5th Ed...Chemical EngineeringISBN:9780133887518Author:H. Scott FoglerPublisher:Prentice Hall
 Industrial Plastics: Theory and ApplicationsChemical EngineeringISBN:9781285061238Author:Lokensgard, ErikPublisher:Delmar Cengage Learning
 Unit Operations of Chemical EngineeringChemical EngineeringISBN:9780072848236Author:Warren McCabe, Julian C. Smith, Peter HarriottPublisher:McGraw-Hill Companies, The


