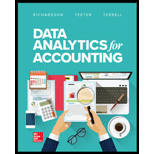
Data Analytics For Accounting
19th Edition
ISBN: 9781260375190
Author: RICHARDSON, Vernon J., Teeter, Ryan, Terrell, Katie
Publisher: Mcgraw-hill Education,
expand_more
expand_more
format_list_bulleted
Concept explainers
Textbook Question
Chapter 7, Problem 6P
If Time to Market is considered a key KPI for a company, what would be an appropriate benchmark? The industry’s Time to Market? The average Time to Market for the company for the past five years? The competitors’ Time to Market?
- a. How will you know if the company is making progress?
- b. How might Data Analytics help with this?
- c. How often would you need a measure of Time to Market? Monthly? Quarterly? Annually?
Expert Solution & Answer
Want to see the full answer?
Check out a sample textbook solution
Students have asked these similar questions
I need guidance with this general accounting problem using the right accounting principles.
Please provide the answer to this general accounting question using the right approach.
Please explain the solution to this general accounting problem using the correct accounting principles.
Chapter 7 Solutions
Data Analytics For Accounting
Ch. 7 - What would you consider to be Financial...Ch. 7 - Prob. 2MCQCh. 7 - What does KPI stand for? a. Key performance index...Ch. 7 - Prob. 4MCQCh. 7 - Prob. 5MCQCh. 7 - On a Balanced Scorecard, which is not included as...Ch. 7 - Prob. 7MCQCh. 7 - Prob. 8MCQCh. 7 - Prob. 9MCQCh. 7 - Prob. 10MCQ
Ch. 7 - We know that a Balanced Scorecard is comprised of...Ch. 7 - Prob. 2DQCh. 7 - Amazon, in the authors opinion, has cared less...Ch. 7 - For an accounting firm like PwC, how would the...Ch. 7 - For a company like Walmart, how would the Balanced...Ch. 7 - Prob. 6DQCh. 7 - If the data underlying your digital dashboard are...Ch. 7 - In which of the four components of a Balanced...Ch. 7 - From Exhibit 7-5, choose 5 Financial Performance...Ch. 7 - From Exhibit 7-5, choose 10 Employee Performance...Ch. 7 - From Exhibit 7-5, choose 10 Marketing KPIs to...Ch. 7 - Prob. 4PCh. 7 - If ROA is considered a key KPI for a company, what...Ch. 7 - If Time to Market is considered a key KPI for a...Ch. 7 - Prob. 7P
Knowledge Booster
Learn more about
Need a deep-dive on the concept behind this application? Look no further. Learn more about this topic, accounting and related others by exploring similar questions and additional content below.Similar questions
- Please explain this financial accounting problem by applying valid financial principles.arrow_forwardI need the correct answer to this general accounting problem using the standard accounting approach.arrow_forwardCronix Metal Works manufactures a single product that sells for $88 per unit. Variable costs are $56 per unit, and fixed costs total $145,000 per month. Calculate the operating income if the selling price is raised to $91 per unit, advertising expenditures are increased by $20,000 per month, and monthly unit sales volume becomes 5,800 units.arrow_forward
- Please explain the accurate process for solving this financial accounting question with proper principles.arrow_forwardCan you explain the correct approach to solve this general accounting question?arrow_forwardI need the correct answer to this general accounting problem using the standard accounting approach.arrow_forward
- Please explain the correct approach for solving this general accounting question.arrow_forwardNamita's Salon purchased equipment for $12,000 on January 1. The equipment has an estimated useful life of 5 years and a salvage value of $2,000. Calculate the annual depreciation expense using the straight-line method and the book value at the end of year 3.arrow_forwardI am searching for a clear explanation of this financial accounting problem with valid methods.arrow_forward
arrow_back_ios
SEE MORE QUESTIONS
arrow_forward_ios
Recommended textbooks for you
 Intermediate Financial Management (MindTap Course...FinanceISBN:9781337395083Author:Eugene F. Brigham, Phillip R. DavesPublisher:Cengage Learning
 Essentials of Business Analytics (MindTap Course ...StatisticsISBN:9781305627734Author:Jeffrey D. Camm, James J. Cochran, Michael J. Fry, Jeffrey W. Ohlmann, David R. AndersonPublisher:Cengage Learning
 Fundamentals Of Financial Management, Concise Edi...FinanceISBN:9781337902571Author:Eugene F. Brigham, Joel F. HoustonPublisher:Cengage Learning
 Fundamentals of Financial Management, Concise Edi...FinanceISBN:9781285065137Author:Eugene F. Brigham, Joel F. HoustonPublisher:Cengage Learning
 Fundamentals of Financial Management, Concise Edi...FinanceISBN:9781305635937Author:Eugene F. Brigham, Joel F. HoustonPublisher:Cengage Learning


Intermediate Financial Management (MindTap Course...
Finance
ISBN:9781337395083
Author:Eugene F. Brigham, Phillip R. Daves
Publisher:Cengage Learning

Essentials of Business Analytics (MindTap Course ...
Statistics
ISBN:9781305627734
Author:Jeffrey D. Camm, James J. Cochran, Michael J. Fry, Jeffrey W. Ohlmann, David R. Anderson
Publisher:Cengage Learning

Fundamentals Of Financial Management, Concise Edi...
Finance
ISBN:9781337902571
Author:Eugene F. Brigham, Joel F. Houston
Publisher:Cengage Learning

Fundamentals of Financial Management, Concise Edi...
Finance
ISBN:9781285065137
Author:Eugene F. Brigham, Joel F. Houston
Publisher:Cengage Learning

Fundamentals of Financial Management, Concise Edi...
Finance
ISBN:9781305635937
Author:Eugene F. Brigham, Joel F. Houston
Publisher:Cengage Learning
Responsibility Accounting| Responsibility Centers and Segments| US CMA Part 1| US CMA course; Master Budget and Responsibility Accounting-Intro to Managerial Accounting- Su. 2013-Prof. Gershberg; Author: Mera Skill; Rutgers Accounting Web;https://www.youtube.com/watch?v=SYQ4u1BP24g;License: Standard YouTube License, CC-BY