
Probability and Statistics for Engineering and the Sciences STAT 400 - University Of Maryland
9th Edition
ISBN: 9781305764477
Author: Jay L. Devore
Publisher: Cengage Learning
expand_more
expand_more
format_list_bulleted
Concept explainers
Videos
Textbook Question
Chapter 7, Problem 56SE
The accompanying data on crack initiation depth (μm) was read from a lognormal probability plot that appeared in the article “Incorporating Small Fatigue Crack Growth in Probabilistic Life Prediction: Effect of Stress Ratio in Ti-6Al-2Sn-6Mo” (Intl. J. of Fatigue, 2013: 83–95). Although the pattern in the plot was quite straight, a normal probability plot of the data also shows a reasonably linear pattern. And a boxplot indicates that the distribution is quite symmetric in the middle 50% of the data and only mildly skewed overall. It is therefore reasonable to estimate and predict using t intervals.
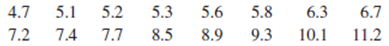
- a. Estimate the true average crack initiation depth with a 99% CI and interpret the resulting interval.
- b. Predict the value of a single crack initiation depth by constructing a 99% PI.
- c. Interpret in context the meaning of 99% in (b).
Expert Solution & Answer

Trending nowThis is a popular solution!

Students have asked these similar questions
According to an economist from a financial company, the average expenditures on "furniture and household appliances" have been lower for households in the Montreal area than those in the Quebec region.
A random sample of 14 households from the Montreal region and 16 households from the Quebec region was taken, providing the following data regarding expenditures in this economic sector.
It is assumed that the data from each population are distributed normally.
We are interested in knowing if the variances of the populations are equal. a) Perform the appropriate hypothesis test on two variances at a significance level of 1%. Include the following information:
i. Hypothesis / Identification of populations ii. Critical F-value(s) iii. Decision rule iv. F-ratio value v. Decision and conclusion
b) Based on the results obtained in a), is the hypothesis of equal variances for this socio-economic characteristic measured in these two populations upheld?
c) Based on the results obtained in a),…
A major company in the Montreal area, offering a range of engineering services from project preparation to construction execution, and industrial project management, wants to ensure that the individuals who are responsible for project cost estimation and bid preparation demonstrate a certain uniformity in their estimates. The head of civil engineering and municipal services decided to structure an experimental plan to detect if there could be significant differences in project evaluation.
Seven projects were selected, each of which had to be evaluated by each of the two estimators, with the order of the projects submitted being random. The obtained estimates are presented in the table below.
a) Complete the table above by calculating: i. The differences (A-B) ii. The sum of the differences iii. The mean of the differences iv. The standard deviation of the differences
b) What is the value of the t-statistic?
c) What is the critical t-value for this test at a significance level of 1%?…
Compute the relative risk of falling for the two groups (did not stop walking vs. did stop). State/interpret your result verbally.
Chapter 7 Solutions
Probability and Statistics for Engineering and the Sciences STAT 400 - University Of Maryland
Ch. 7.1 - Consider a normal population distribution with the...Ch. 7.1 - Each of the following is a confidence interval for...Ch. 7.1 - Suppose that a random sample of 50 bottles of a...Ch. 7.1 - A CI is desired for the true average stray-load...Ch. 7.1 - Assume that the helium porosity (in percentage) of...Ch. 7.1 - On the basis of extensive tests, the yield point...Ch. 7.1 - By how much must the sample size n be increased if...Ch. 7.1 - Let 1 0, 2 0, with 1 + 2 = . Then P(z1X-/nz2)=1-...Ch. 7.1 - a. Under the same conditions as those leading to...Ch. 7.1 - A random sample of n = 15 heat pumps of a certain...
Ch. 7.1 - Consider the next 1000 95% CIs for that a...Ch. 7.2 - The following observations are lifetimes (days)...Ch. 7.2 - The article Gas Cooking. Kitchen Ventilation, and...Ch. 7.2 - The negative effects of ambient air pollution on...Ch. 7.2 - Determine the confidence level for each of the...Ch. 7.2 - The alternating current (AC) breakdown voltage of...Ch. 7.2 - Exercise 1.13 gave a sample of ultimate tensile...Ch. 7.2 - The U.S. Army commissioned a study to assess how...Ch. 7.2 - The article Limited Yield Estimation for Visual...Ch. 7.2 - TV advertising agencies face increasing challenges...Ch. 7.2 - In a sample of 1000 randomly selected consumers...Ch. 7.2 - The technology underlying hip replacements has...Ch. 7.2 - The Pew Forum on Religion and Public Life reported...Ch. 7.2 - A sample of 56 research cotton samples resulted in...Ch. 7.2 - The Pew Forum on Religion and Public Life reported...Ch. 7.2 - The superintendent of a large school district,...Ch. 7.2 - Reconsider the CI (7.10) for p, and focus on a...Ch. 7.3 - Determine the values of the following quantities:...Ch. 7.3 - Determine the t critical value(s) that will...Ch. 7.3 - Determine the t critical value for a two-sided...Ch. 7.3 - Determine the t critical value for a lower or an...Ch. 7.3 - According to the article Fatigue Testing of...Ch. 7.3 - The article Measuring and Understanding the Aging...Ch. 7.3 - A sample of 14 joint specimens of a particular...Ch. 7.3 - Silicone implant augmentation rhinoplasty is used...Ch. 7.3 - A normal probability plot of the n = 26...Ch. 7.3 - A study of the ability of individuals to walk in a...Ch. 7.3 - Ultra high performance concrete (UHPC) is a...Ch. 7.3 - Exercise 72 of Chapter 1 gave the following...Ch. 7.3 - Prob. 40ECh. 7.3 - A more extensive tabulation of t critical values...Ch. 7.4 - Determine the values of the following quantities:...Ch. 7.4 - Determine the following: a. The 95th percentile of...Ch. 7.4 - The amount of lateral expansion (mils) was...Ch. 7.4 - Wire electrical-discharge machining (WEDM) is a...Ch. 7.4 - Wire electrical-discharge machining (WEDM) is a...Ch. 7 - Example 1.11 introduced the accompanying...Ch. 7 - The article Distributions of Compressive Strength...Ch. 7 - For those of you who dont already know, dragon...Ch. 7 - A journal article reports that a sample of size 5...Ch. 7 - Unexplained respiratory symptoms reported by...Ch. 7 - High concentration of the toxic element arsenic is...Ch. 7 - Aphid infestation of fruit trees can be controlled...Ch. 7 - It is important that face masks used by...Ch. 7 - A manufacturer of college textbooks is interested...Ch. 7 - The accompanying data on crack initiation depth...Ch. 7 - In Example 6.8, we introduced the concept of a...Ch. 7 - Prob. 58SECh. 7 - Prob. 59SECh. 7 - Prob. 60SECh. 7 - Prob. 61SECh. 7 - Prob. 62SE
Knowledge Booster


Learn more about
Need a deep-dive on the concept behind this application? Look no further. Learn more about this topic, statistics and related others by exploring similar questions and additional content below.Similar questions
- Microsoft Excel include formulasarrow_forwardQuestion 1 The data shown in Table 1 are and R values for 24 samples of size n = 5 taken from a process producing bearings. The measurements are made on the inside diameter of the bearing, with only the last three decimals recorded (i.e., 34.5 should be 0.50345). Table 1: Bearing Diameter Data Sample Number I R Sample Number I R 1 34.5 3 13 35.4 8 2 34.2 4 14 34.0 6 3 31.6 4 15 37.1 5 4 31.5 4 16 34.9 7 5 35.0 5 17 33.5 4 6 34.1 6 18 31.7 3 7 32.6 4 19 34.0 8 8 33.8 3 20 35.1 9 34.8 7 21 33.7 2 10 33.6 8 22 32.8 1 11 31.9 3 23 33.5 3 12 38.6 9 24 34.2 2 (a) Set up and R charts on this process. Does the process seem to be in statistical control? If necessary, revise the trial control limits. [15 pts] (b) If specifications on this diameter are 0.5030±0.0010, find the percentage of nonconforming bearings pro- duced by this process. Assume that diameter is normally distributed. [10 pts] 1arrow_forward4. (5 pts) Conduct a chi-square contingency test (test of independence) to assess whether there is an association between the behavior of the elderly person (did not stop to talk, did stop to talk) and their likelihood of falling. Below, please state your null and alternative hypotheses, calculate your expected values and write them in the table, compute the test statistic, test the null by comparing your test statistic to the critical value in Table A (p. 713-714) of your textbook and/or estimating the P-value, and provide your conclusions in written form. Make sure to show your work. Did not stop walking to talk Stopped walking to talk Suffered a fall 12 11 Totals 23 Did not suffer a fall | 2 Totals 35 37 14 46 60 Tarrow_forward
- Question 2 Parts manufactured by an injection molding process are subjected to a compressive strength test. Twenty samples of five parts each are collected, and the compressive strengths (in psi) are shown in Table 2. Table 2: Strength Data for Question 2 Sample Number x1 x2 23 x4 x5 R 1 83.0 2 88.6 78.3 78.8 3 85.7 75.8 84.3 81.2 78.7 75.7 77.0 71.0 84.2 81.0 79.1 7.3 80.2 17.6 75.2 80.4 10.4 4 80.8 74.4 82.5 74.1 75.7 77.5 8.4 5 83.4 78.4 82.6 78.2 78.9 80.3 5.2 File Preview 6 75.3 79.9 87.3 89.7 81.8 82.8 14.5 7 74.5 78.0 80.8 73.4 79.7 77.3 7.4 8 79.2 84.4 81.5 86.0 74.5 81.1 11.4 9 80.5 86.2 76.2 64.1 80.2 81.4 9.9 10 75.7 75.2 71.1 82.1 74.3 75.7 10.9 11 80.0 81.5 78.4 73.8 78.1 78.4 7.7 12 80.6 81.8 79.3 73.8 81.7 79.4 8.0 13 82.7 81.3 79.1 82.0 79.5 80.9 3.6 14 79.2 74.9 78.6 77.7 75.3 77.1 4.3 15 85.5 82.1 82.8 73.4 71.7 79.1 13.8 16 78.8 79.6 80.2 79.1 80.8 79.7 2.0 17 82.1 78.2 18 84.5 76.9 75.5 83.5 81.2 19 79.0 77.8 20 84.5 73.1 78.2 82.1 79.2 81.1 7.6 81.2 84.4 81.6 80.8…arrow_forwardName: Lab Time: Quiz 7 & 8 (Take Home) - due Wednesday, Feb. 26 Contingency Analysis (Ch. 9) In lab 5, part 3, you will create a mosaic plot and conducted a chi-square contingency test to evaluate whether elderly patients who did not stop walking to talk (vs. those who did stop) were more likely to suffer a fall in the next six months. I have tabulated the data below. Answer the questions below. Please show your calculations on this or a separate sheet. Did not stop walking to talk Stopped walking to talk Totals Suffered a fall Did not suffer a fall Totals 12 11 23 2 35 37 14 14 46 60 Quiz 7: 1. (2 pts) Compute the odds of falling for each group. Compute the odds ratio for those who did not stop walking vs. those who did stop walking. Interpret your result verbally.arrow_forwardSolve please and thank you!arrow_forward
- 7. In a 2011 article, M. Radelet and G. Pierce reported a logistic prediction equation for the death penalty verdicts in North Carolina. Let Y denote whether a subject convicted of murder received the death penalty (1=yes), for the defendant's race h (h1, black; h = 2, white), victim's race i (i = 1, black; i = 2, white), and number of additional factors j (j = 0, 1, 2). For the model logit[P(Y = 1)] = a + ß₁₂ + By + B²², they reported = -5.26, D â BD = 0, BD = 0.17, BY = 0, BY = 0.91, B = 0, B = 2.02, B = 3.98. (a) Estimate the probability of receiving the death penalty for the group most likely to receive it. [4 pts] (b) If, instead, parameters used constraints 3D = BY = 35 = 0, report the esti- mates. [3 pts] h (c) If, instead, parameters used constraints Σ₁ = Σ₁ BY = Σ; B = 0, report the estimates. [3 pts] Hint the probabilities, odds and odds ratios do not change with constraints.arrow_forwardSolve please and thank you!arrow_forwardSolve please and thank you!arrow_forward
- Question 1:We want to evaluate the impact on the monetary economy for a company of two types of strategy (competitive strategy, cooperative strategy) adopted by buyers.Competitive strategy: strategy characterized by firm behavior aimed at obtaining concessions from the buyer.Cooperative strategy: a strategy based on a problem-solving negotiating attitude, with a high level of trust and cooperation.A random sample of 17 buyers took part in a negotiation experiment in which 9 buyers adopted the competitive strategy, and the other 8 the cooperative strategy. The savings obtained for each group of buyers are presented in the pdf that i sent: For this problem, we assume that the samples are random and come from two normal populations of unknown but equal variances.According to the theory, the average saving of buyers adopting a competitive strategy will be lower than that of buyers adopting a cooperative strategy.a) Specify the population identifications and the hypotheses H0 and H1…arrow_forwardYou assume that the annual incomes for certain workers are normal with a mean of $28,500 and a standard deviation of $2,400. What’s the chance that a randomly selected employee makes more than $30,000?What’s the chance that 36 randomly selected employees make more than $30,000, on average?arrow_forwardWhat’s the chance that a fair coin comes up heads more than 60 times when you toss it 100 times?arrow_forward
arrow_back_ios
SEE MORE QUESTIONS
arrow_forward_ios
Recommended textbooks for you

Statistics 4.1 Point Estimators; Author: Dr. Jack L. Jackson II;https://www.youtube.com/watch?v=2MrI0J8XCEE;License: Standard YouTube License, CC-BY
Statistics 101: Point Estimators; Author: Brandon Foltz;https://www.youtube.com/watch?v=4v41z3HwLaM;License: Standard YouTube License, CC-BY
Central limit theorem; Author: 365 Data Science;https://www.youtube.com/watch?v=b5xQmk9veZ4;License: Standard YouTube License, CC-BY
Point Estimate Definition & Example; Author: Prof. Essa;https://www.youtube.com/watch?v=OTVwtvQmSn0;License: Standard Youtube License
Point Estimation; Author: Vamsidhar Ambatipudi;https://www.youtube.com/watch?v=flqhlM2bZWc;License: Standard Youtube License