
Excursions in Mathematics, Loose-Leaf Edition Plus MyLab Math with Pearson eText -- 18 Week Access Card Package
9th Edition
ISBN: 9780136208754
Author: Tannenbaum, Peter
Publisher: PEARSON
expand_more
expand_more
format_list_bulleted
Videos
Textbook Question
Chapter 7, Problem 39E
Find the MST of the network shown in Fig. 7-40 using Kruskal's algorithm, and give its weight.
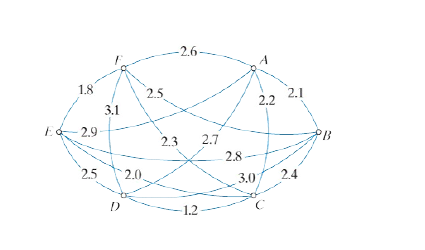
Figure 7-40
Expert Solution & Answer
Want to see the full answer?
Check out a sample textbook solution
Students have asked these similar questions
Draw the triangle and show all the work
The average miles per gallon for a sample of 40 cars of model SX last year was 32.1, with a population standard deviation of 3.8. A sample of 40 cars from this year’s model SX has an average of 35.2 mpg, with a population standard deviation of 5.4.
Find a 99 percent confidence interval for the difference in average mpg for this car brand (this year’s model minus last year’s).Find a 99 percent confidence interval for the difference in average mpg for last year’s model minus this year’s. What does the negative difference mean?
A special interest group reports a tiny margin of error (plus or minus 0.04 percent) for its online survey based on 50,000 responses. Is the margin of error legitimate? (Assume that the group’s math is correct.)
Chapter 7 Solutions
Excursions in Mathematics, Loose-Leaf Edition Plus MyLab Math with Pearson eText -- 18 Week Access Card Package
Ch. 7 - A computer lab has seven computers labeled A...Ch. 7 - The following is a list of the electrical power...Ch. 7 - Consider the network shown in Fig.720_. a. How...Ch. 7 - Consider the network shown in Fig.721_. a. How...Ch. 7 - Consider once again the network shown in. Fig720_....Ch. 7 - Consider once again the network shown in. Fig721_....Ch. 7 - Consider the network shown in. Fig722. This is the...Ch. 7 - Consider the network shown in. Fig723_. This is...Ch. 7 - Consider the tree shown in. Fig724_. a. How many...Ch. 7 - Consider the tree shown in. Fig725. a. How many...
Ch. 7 - In Exercises 11 through 24 you are given...Ch. 7 - Prob. 12ECh. 7 - Prob. 13ECh. 7 - Prob. 14ECh. 7 - In Exercises 11 through 24 you are given...Ch. 7 - Prob. 16ECh. 7 - Prob. 17ECh. 7 - Prob. 18ECh. 7 - Prob. 19ECh. 7 - In Exercises 11 through 24 you are given...Ch. 7 - Prob. 21ECh. 7 - Prob. 22ECh. 7 - Prob. 23ECh. 7 - Prob. 24ECh. 7 - Prob. 25ECh. 7 - Consider the network shown in Fig.727_. a. Find a...Ch. 7 - Prob. 27ECh. 7 - Consider the network shown in Fig.729_. a. Find a...Ch. 7 - Prob. 29ECh. 7 - Prob. 30ECh. 7 - Prob. 31ECh. 7 - Prob. 32ECh. 7 - Prob. 33ECh. 7 - Prob. 34ECh. 7 - Prob. 35ECh. 7 - The 4 by 5 grid shown in Fig. 7-37 represents a...Ch. 7 - Prob. 37ECh. 7 - Find the MST of the network shown in Fig. 7-39...Ch. 7 - Find the MST of the network shown in Fig. 7-40...Ch. 7 - Find the MST of the network shown in Fig. 7-41...Ch. 7 - Prob. 41ECh. 7 - Find the MaxST of the network shown in Fig. 7-39...Ch. 7 - Find the MaxST of the network shown in Fig. 7-40...Ch. 7 - Prob. 44ECh. 7 - The mileage chart in Fig. 742 shows the distances...Ch. 7 - Figure 7-43a shows a network of roads connecting...Ch. 7 - Prob. 47ECh. 7 - Prob. 48ECh. 7 - Prob. 49ECh. 7 - This exercise refers to weighted networks where...Ch. 7 - Prob. 51ECh. 7 - Prob. 52ECh. 7 - Prob. 53ECh. 7 - Prob. 54ECh. 7 - Prob. 55ECh. 7 - Prob. 56ECh. 7 - A bipartite graph is a graph with the property...Ch. 7 - Prob. 58ECh. 7 - Prob. 59E
Knowledge Booster


Learn more about
Need a deep-dive on the concept behind this application? Look no further. Learn more about this topic, subject and related others by exploring similar questions and additional content below.Similar questions
- Suppose that 73 percent of a sample of 1,000 U.S. college students drive a used car as opposed to a new car or no car at all. Find an 80 percent confidence interval for the percentage of all U.S. college students who drive a used car.What sample size would cut this margin of error in half?arrow_forwardYou want to compare the average number of tines on the antlers of male deer in two nearby metro parks. A sample of 30 deer from the first park shows an average of 5 tines with a population standard deviation of 3. A sample of 35 deer from the second park shows an average of 6 tines with a population standard deviation of 3.2. Find a 95 percent confidence interval for the difference in average number of tines for all male deer in the two metro parks (second park minus first park).Do the parks’ deer populations differ in average size of deer antlers?arrow_forwardSuppose that you want to increase the confidence level of a particular confidence interval from 80 percent to 95 percent without changing the width of the confidence interval. Can you do it?arrow_forward
- A random sample of 1,117 U.S. college students finds that 729 go home at least once each term. Find a 98 percent confidence interval for the proportion of all U.S. college students who go home at least once each term.arrow_forwardSuppose that you make two confidence intervals with the same data set — one with a 95 percent confidence level and the other with a 99.7 percent confidence level. Which interval is wider?Is a wide confidence interval a good thing?arrow_forwardIs it true that a 95 percent confidence interval means you’re 95 percent confident that the sample statistic is in the interval?arrow_forward
- Tines can range from 2 to upwards of 50 or more on a male deer. You want to estimate the average number of tines on the antlers of male deer in a nearby metro park. A sample of 30 deer has an average of 5 tines, with a population standard deviation of 3. Find a 95 percent confidence interval for the average number of tines for all male deer in this metro park.Find a 98 percent confidence interval for the average number of tines for all male deer in this metro park.arrow_forwardBased on a sample of 100 participants, the average weight loss the first month under a new (competing) weight-loss plan is 11.4 pounds with a population standard deviation of 5.1 pounds. The average weight loss for the first month for 100 people on the old (standard) weight-loss plan is 12.8 pounds, with population standard deviation of 4.8 pounds. Find a 90 percent confidence interval for the difference in weight loss for the two plans( old minus new) Whats the margin of error for your calculated confidence interval?arrow_forwardA 95 percent confidence interval for the average miles per gallon for all cars of a certain type is 32.1, plus or minus 1.8. The interval is based on a sample of 40 randomly selected cars. What units represent the margin of error?Suppose that you want to decrease the margin of error, but you want to keep 95 percent confidence. What should you do?arrow_forward
- Let v₁ = (2,-3,7,8), v2 = (3, 10, -6, 14), v3 = (0, 19, -2, 16), and v₁ = (9, -2, 1, 10). Is the set {V1, V2, V3, V4} a basis for R4? Of the two sets S = {(3x-5y, 4x + 7y, x+9y): x, y = R} and T = {2x-3y+z, -7x-3y²+z, 4x + 3z): x, y, z = R} which is a subspace of R3? (S, T, both, neither) Justify.arrow_forwardCan you help me solve this?arrow_forwardFind a basis and dimension for the null space of the following matrix: 3 -2 0 7 -2 1-1 1 5 3 19-2 8 06 1 -2 -4 -5-6 -9 4-6 11 6 Find a basis and dimension for the column space of the same matrix (above).arrow_forward
arrow_back_ios
SEE MORE QUESTIONS
arrow_forward_ios
Recommended textbooks for you
 Discrete Mathematics and Its Applications ( 8th I...MathISBN:9781259676512Author:Kenneth H RosenPublisher:McGraw-Hill Education
 Mathematics for Elementary Teachers with Activiti...MathISBN:9780134392790Author:Beckmann, SybillaPublisher:PEARSON
 Thinking Mathematically (7th Edition)MathISBN:9780134683713Author:Robert F. BlitzerPublisher:PEARSON
 Discrete Mathematics With ApplicationsMathISBN:9781337694193Author:EPP, Susanna S.Publisher:Cengage Learning,
 Pathways To Math Literacy (looseleaf)MathISBN:9781259985607Author:David Sobecki Professor, Brian A. MercerPublisher:McGraw-Hill Education
Discrete Mathematics and Its Applications ( 8th I...
Math
ISBN:9781259676512
Author:Kenneth H Rosen
Publisher:McGraw-Hill Education
Mathematics for Elementary Teachers with Activiti...
Math
ISBN:9780134392790
Author:Beckmann, Sybilla
Publisher:PEARSON
Thinking Mathematically (7th Edition)
Math
ISBN:9780134683713
Author:Robert F. Blitzer
Publisher:PEARSON
Discrete Mathematics With Applications
Math
ISBN:9781337694193
Author:EPP, Susanna S.
Publisher:Cengage Learning,
Pathways To Math Literacy (looseleaf)
Math
ISBN:9781259985607
Author:David Sobecki Professor, Brian A. Mercer
Publisher:McGraw-Hill Education
Graph Theory: Euler Paths and Euler Circuits; Author: Mathispower4u;https://www.youtube.com/watch?v=5M-m62qTR-s;License: Standard YouTube License, CC-BY
WALK,TRIAL,CIRCUIT,PATH,CYCLE IN GRAPH THEORY; Author: DIVVELA SRINIVASA RAO;https://www.youtube.com/watch?v=iYVltZtnAik;License: Standard YouTube License, CC-BY