
Excursions in Mathematics, Loose-Leaf Edition Plus MyLab Math with Pearson eText -- 18 Week Access Card Package
9th Edition
ISBN: 9780136208754
Author: Tannenbaum, Peter
Publisher: PEARSON
expand_more
expand_more
format_list_bulleted
Videos
Textbook Question
Chapter 7, Problem 26E
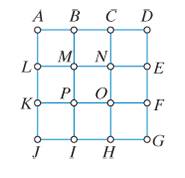
Consider the network shown in
a. Find a spanning tree of the network.
b. Calculate the redundancy of the network.
c. What is the diameter of the network?
Expert Solution & Answer
Want to see the full answer?
Check out a sample textbook solution
Students have asked these similar questions
pls help
Solve please and thanks!
Solve please and thanks!
Chapter 7 Solutions
Excursions in Mathematics, Loose-Leaf Edition Plus MyLab Math with Pearson eText -- 18 Week Access Card Package
Ch. 7 - A computer lab has seven computers labeled A...Ch. 7 - The following is a list of the electrical power...Ch. 7 - Consider the network shown in Fig.720_. a. How...Ch. 7 - Consider the network shown in Fig.721_. a. How...Ch. 7 - Consider once again the network shown in. Fig720_....Ch. 7 - Consider once again the network shown in. Fig721_....Ch. 7 - Consider the network shown in. Fig722. This is the...Ch. 7 - Consider the network shown in. Fig723_. This is...Ch. 7 - Consider the tree shown in. Fig724_. a. How many...Ch. 7 - Consider the tree shown in. Fig725. a. How many...
Ch. 7 - In Exercises 11 through 24 you are given...Ch. 7 - Prob. 12ECh. 7 - Prob. 13ECh. 7 - Prob. 14ECh. 7 - In Exercises 11 through 24 you are given...Ch. 7 - Prob. 16ECh. 7 - Prob. 17ECh. 7 - Prob. 18ECh. 7 - Prob. 19ECh. 7 - In Exercises 11 through 24 you are given...Ch. 7 - Prob. 21ECh. 7 - Prob. 22ECh. 7 - Prob. 23ECh. 7 - Prob. 24ECh. 7 - Prob. 25ECh. 7 - Consider the network shown in Fig.727_. a. Find a...Ch. 7 - Prob. 27ECh. 7 - Consider the network shown in Fig.729_. a. Find a...Ch. 7 - Prob. 29ECh. 7 - Prob. 30ECh. 7 - Prob. 31ECh. 7 - Prob. 32ECh. 7 - Prob. 33ECh. 7 - Prob. 34ECh. 7 - Prob. 35ECh. 7 - The 4 by 5 grid shown in Fig. 7-37 represents a...Ch. 7 - Prob. 37ECh. 7 - Find the MST of the network shown in Fig. 7-39...Ch. 7 - Find the MST of the network shown in Fig. 7-40...Ch. 7 - Find the MST of the network shown in Fig. 7-41...Ch. 7 - Prob. 41ECh. 7 - Find the MaxST of the network shown in Fig. 7-39...Ch. 7 - Find the MaxST of the network shown in Fig. 7-40...Ch. 7 - Prob. 44ECh. 7 - The mileage chart in Fig. 742 shows the distances...Ch. 7 - Figure 7-43a shows a network of roads connecting...Ch. 7 - Prob. 47ECh. 7 - Prob. 48ECh. 7 - Prob. 49ECh. 7 - This exercise refers to weighted networks where...Ch. 7 - Prob. 51ECh. 7 - Prob. 52ECh. 7 - Prob. 53ECh. 7 - Prob. 54ECh. 7 - Prob. 55ECh. 7 - Prob. 56ECh. 7 - A bipartite graph is a graph with the property...Ch. 7 - Prob. 58ECh. 7 - Prob. 59E
Knowledge Booster


Learn more about
Need a deep-dive on the concept behind this application? Look no further. Learn more about this topic, subject and related others by exploring similar questions and additional content below.Similar questions
- The graph of the function f in the figure below consists of line segments and a semicircle. Let g be the function given by x 9(x) = * f(t)dt. Determine all values of r, if any, where g has a relative minimum on the open interval (-9, 9). y 8 7 6 5 4 32 1 Graph of f x -10 -9 -8 -7 -6 -5 -4 -3 -2 -1 1 2 3 4 5 6 7 8 9 10 -1 -2 -3 -4 -5 -6 678 -7 -8arrow_forwardSolve pleasearrow_forwardElementary StatisticsBase on the same given data uploaded in module 4, will you conclude that the number of bathroom of houses is a significant factor for house sellprice? I your answer is affirmative, you need to explain how the number of bathroom influences the house price, using a post hoc procedure. (Please treat number of bathrooms as a categorical variable in this analysis)Base on the same given data, conduct an analysis for the variable sellprice to see if sale price is influenced by living area. Summarize your finding including all regular steps (learned in this module) for your method. Also, will you conclude that larger house corresponding to higher price (justify)?Each question need to include a spss or sas output. Instructions: You have to use SAS or SPSS to perform appropriate procedure: ANOVA or Regression based on the project data (provided in the module 4) and research question in the project file. Attach the computer output of all key steps (number) quoted in…arrow_forward
- Elementary StatsBase on the given data uploaded in module 4, change the variable sale price into two categories: abovethe mean price or not; and change the living area into two categories: above the median living area ornot ( your two group should have close number of houses in each group). Using the resulting variables,will you conclude that larger house corresponding to higher price?Note: Need computer output, Ho and Ha, P and decision. If p is small, you need to explain what type ofdependency (association) we have using an appropriate pair of percentages. Please include how to use the data in SPSS and interpretation of data.arrow_forwardA particle moves along the x-axis for 0 < t < 18 such that its velocity is given by the graph shown below. Find the total distance traveled by the particle during the time interval 4 ≤ t ≤ 8. 8 y 7 6 5 4 32 1 6 7 -1 1 2 3 4 5 -1 -2 -3 -4 56 -6 -8 8 00 Graph of v(t) x 9 10 11 12 13 14 15 16 17 18 19arrow_forwardUsing the Chain rule please and thank youarrow_forward
- An environmental research team is studying the daily rainfall (in millimeters) in a region over 100 days. The data is grouped into the following histogram bins: Rainfall Range (mm) Frequency 0-9.9 15 10 19.9 25 20-29.9 30 30-39.9 20 ||40-49.9 10 a) If a random day is selected, what is the probability that the rainfall was at least 20 mm but less than 40 mm? b) Estimate the mean daily rainfall, assuming the rainfall in each bin is uniformly distributed and the midpoint of each bin represents the average rainfall for that range. c) Construct the cumulative frequency distribution and determine the rainfall level below which 75% of the days fall. d) Calculate the estimated variance and standard deviation of the daily rainfall based on the histogram data.arrow_forwardProblem 2: The 1000 kg car at rest slides down from A along the track without friction. Determine: the force exerted by the track on the car at point B, and the minimum safe value of the radius of curvature at point C. 5 m + C T=6m 15 m Barrow_forwardProblem 1: In a softball game, Peter throws a ball with an initial velocity Vo 120 km/h at an angle a. At Point B, the height of the ball is 0.7 m. determine (a) the angle a, (b) the angle 0 of the velocity when the ball reaches at Point B. Pr the tra rac 0.7 m B 14 m 0.58 marrow_forward
arrow_back_ios
SEE MORE QUESTIONS
arrow_forward_ios
Recommended textbooks for you
 Algebra & Trigonometry with Analytic GeometryAlgebraISBN:9781133382119Author:SwokowskiPublisher:Cengage
 Algebra: Structure And Method, Book 1AlgebraISBN:9780395977224Author:Richard G. Brown, Mary P. Dolciani, Robert H. Sorgenfrey, William L. ColePublisher:McDougal Littell
Algebra & Trigonometry with Analytic Geometry
Algebra
ISBN:9781133382119
Author:Swokowski
Publisher:Cengage
Algebra: Structure And Method, Book 1
Algebra
ISBN:9780395977224
Author:Richard G. Brown, Mary P. Dolciani, Robert H. Sorgenfrey, William L. Cole
Publisher:McDougal Littell
Algebra - Pythagorean Theorem; Author: yaymath;https://www.youtube.com/watch?v=D_y_owf1WsI;License: Standard YouTube License, CC-BY
The Organic Chemistry Tutor; Author: Pythagorean Theorem Explained!;https://www.youtube.com/watch?v=B0G35RkmwSw;License: Standard Youtube License