
Concept explainers
Videos
a.
Find the expected number of guests to accept the invitation.
a.
Answer to Problem 36E
The expected number of guests to accept the invitation is 160.
Explanation of Solution
It is given that 80% of the guests respond to invitations that they will attend the wedding and the total number of invitations planned is 200. The number of guests responds to invitation that they will attend the wedding follows a binomial distribution.
That is,
The mean can be obtained as follows:
Thus, the expected number of guests to accept the invitation is 160.
b.
Find the standard deviation.
b.
Answer to Problem 36E
The standard deviation is 5.65.
Explanation of Solution
The standard deviation can be obtained as follows:
Therefore, the standard deviation is 5.65.
c.
Find the
c.
Answer to Problem 36E
The probability that 150 or more will accept the invitation is 0.9679.
Explanation of Solution
The probability that 150 or more will accept the invitation can be obtained as follows:
Step-by-step procedure to obtain the probability using Excel:
- Click on the Formulas tab in the top menu.
- Select Insert
function , then from category box, select Statistical and below that NORM.S.DIST. - Click Ok.
- In the dialog box, Enter Z value as –1.85.
- Enter Cumulative as TRUE.
- Click Ok, the answer appears in the spreadsheet.
Output obtained using Excel is represented as follows:
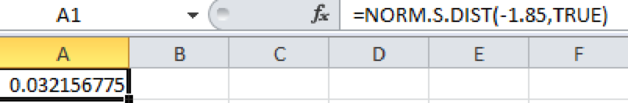
From the above output, the probability of Z less than –1.85 is 0.0321.
Consider,
Therefore, the probability that 150 or more will accept the invitation is 0.9679.
d.
Find the probability that exactly 150 will accept the invitation.
d.
Answer to Problem 36E
The probability that exactly 150 will accept the invitation is 0.0143.
Explanation of Solution
The probability that exactly 150 will accept the invitation can be obtained as follows:
From the previous Subpart c, the probability of Z less than –1.85 is 0.0321.
Step-by-step procedure to obtain the probability using Excel:
- Click on the Formulas tab in the top menu.
- Select Insert function, then from category box, select Statistical and below that NORM.S.DIST.
- Click Ok.
- In the dialog box, Enter Z value as –1.68.
- Enter Cumulative as TRUE.
- Click Ok, the answer appears in the spreadsheet.
Output obtained using Excel is represented as follows:
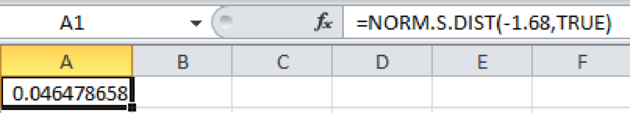
From the above output, the probability of Z less than –1.68 is 0.0464.
Consider,
Thus, the probability that exactly 150 will accept the invitation is 0.0143.
Want to see more full solutions like this?
Chapter 7 Solutions
Loose Leaf for Statistical Techniques in Business and Economics


- Given your fitted regression line, what would be the residual for snake #5 (10 C)?arrow_forwardCalculate the 95% confidence interval around your estimate of r using Fisher’s z-transformation. In your final answer, make sure to back-transform to the original units.arrow_forwardCalculate Pearson’s correlation coefficient (r) between temperature and heart rate.arrow_forward
- A researcher wishes to estimate, with 90% confidence, the population proportion of adults who support labeling legislation for genetically modified organisms (GMOs). Her estimate must be accurate within 4% of the true proportion. (a) No preliminary estimate is available. Find the minimum sample size needed. (b) Find the minimum sample size needed, using a prior study that found that 65% of the respondents said they support labeling legislation for GMOs. (c) Compare the results from parts (a) and (b). ... (a) What is the minimum sample size needed assuming that no prior information is available? n = (Round up to the nearest whole number as needed.)arrow_forwardThe table available below shows the costs per mile (in cents) for a sample of automobiles. At a = 0.05, can you conclude that at least one mean cost per mile is different from the others? Click on the icon to view the data table. Let Hss, HMS, HLS, Hsuv and Hмy represent the mean costs per mile for small sedans, medium sedans, large sedans, SUV 4WDs, and minivans respectively. What are the hypotheses for this test? OA. Ho: Not all the means are equal. Ha Hss HMS HLS HSUV HMV B. Ho Hss HMS HLS HSUV = μMV Ha: Hss *HMS *HLS*HSUV * HMV C. Ho Hss HMS HLS HSUV =μMV = = H: Not all the means are equal. D. Ho Hss HMS HLS HSUV HMV Ha Hss HMS HLS =HSUV = HMVarrow_forwardQuestion: A company launches two different marketing campaigns to promote the same product in two different regions. After one month, the company collects the sales data (in units sold) from both regions to compare the effectiveness of the campaigns. The company wants to determine whether there is a significant difference in the mean sales between the two regions. Perform a two sample T-test You can provide your answer by inserting a text box and the answer must include: Null hypothesis, Alternative hypothesis, Show answer (output table/summary table), and Conclusion based on the P value. (2 points = 0.5 x 4 Answers) Each of these is worth 0.5 points. However, showing the calculation is must. If calculation is missing, the whole answer won't get any credit.arrow_forward

 Holt Mcdougal Larson Pre-algebra: Student Edition...AlgebraISBN:9780547587776Author:HOLT MCDOUGALPublisher:HOLT MCDOUGAL
 Glencoe Algebra 1, Student Edition, 9780079039897...AlgebraISBN:9780079039897Author:CarterPublisher:McGraw Hill
 College Algebra (MindTap Course List)AlgebraISBN:9781305652231Author:R. David Gustafson, Jeff HughesPublisher:Cengage Learning
 Big Ideas Math A Bridge To Success Algebra 1: Stu...AlgebraISBN:9781680331141Author:HOUGHTON MIFFLIN HARCOURTPublisher:Houghton Mifflin Harcourt