
Concept explainers
Videos
The following is an energy-level diagram for electronic transitions in the Bohr hydrogen atom.
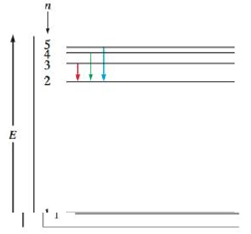
a. Explain why the energy levels get closer together as they increase. Provide mathematical support for this.
b. Verify that the colors given in the diagram are correct. Provide mathematical support.
(a)
Interpretation:
The reason is to be given with mathematical support that energy levels get closer together as they increase. Also the colours given in the diagram is to be checked.
Concept introduction:
The energy level diagram is simply a spectral line which gives the specific amount of energy for transition of energy levels.
To determine: The explanation with mathematical support that energy levels get closer together as they increase.
Answer to Problem 28Q
Answer
Energy levels get closer together because the negative value of energy will become less with the increase in the value of energy levels.
Explanation of Solution
The Danish physicist Niels Bohr proposed the Bohr Model of hydrogen atom in 1913. This model is also applicable for the atoms having one electron or atoms having hydrogen like characteristics.
The separation in lines in the energy level diagram signifies the separation of energy between the orbits. Hydrogen atom consists of only one electron. Hence, it is present at ground state. The difference in the energy state of orbits reduces for higher levels. This is the main reason that the separation between the lines decreases for higher levels.
The expression of energy of hydrogen given by Bohr is.
En=−2.178×10⁻¹⁸ (Z2n2) J
Where,
- En is energy of electron.
- n is an integer orbit in which electrons resides.
- Z is nuclear charge.
The integer value of orbit is inversely proportional to negative energy. As the value of integer is n2 this means that negative value of energy will become less with the increase in the value of n. Hence, the separation between the lines decreases for higher levels.
(b)
Interpretation:
The reason is to be given with mathematical support that energy levels get closer together as they increase. Also the colours given in the diagram is to be checked.
Concept introduction:
The energy level diagram is simply a spectral line which gives the specific amount of energy for transition of energy levels.
To determine: The correctness of red color transition given in the diagram with mathematical support.
Answer to Problem 28Q
Answer
The red color transition is correct.
Explanation of Solution
The diagram below shows the transition state from high to low:
Consider the red color transition from state n=3 to n=2..
The expression of resultant energy is:
ΔE=Ef−Ei (1)
Where,
- ΔE is resultant energy.
- Ef is energy in final state.
- Ei is energy in initial state.
The expression of energy of hydrogen given by Bohr is,
En=−2.178×10⁻¹⁸ (Z2n2) J (2)
The energy of red color transition from state n=3 to n=2 using expression (1) and (2) is calculated,
ΔE=E2−E1=[−2.178×10⁻¹⁸ (1222)]−[−2.178×10⁻¹⁸ (1232)]=−3.03×10⁻¹⁹ J
The negative sign suggests that energy is lost during state transition which means that atom becomes more stable.
The expression of change in energy with respect to wavelength is,
ΔE=hcλλ=hcΔE
Where,
- h is Planks constant.
- c is the speed of light.
- λ is the wavelength.
- ΔE is change in energy.
The value of h is 6.626×10⁻³⁴ J⋅s.
The value of c is 3×10⁸ m/s.
Substitute the value of ΔE, h and c in above expression.
λ=6.626×10⁻³⁴ J⋅s×3×10⁸ m/s−3.03×10−19 J=6.56×10⁻⁷ m
It is clear from the above calculated value of wavelength that red light is in visible spectrum. Hence, color given in this transition is correct.
(c)
Interpretation:
The reason is to be given with mathematical support that energy levels get closer together as they increase. Also the colours given in the diagram is to be checked.
Concept introduction:
The energy level diagram is simply a spectral line which gives the specific amount of energy for transition of energy levels.
To determine: The correctness of green color transition given in the diagram with mathematical support.
Answer to Problem 28Q
Answer
The green color transition is correct.
Explanation of Solution
The diagram below shows the transition state from high to low:
Consider the green color transition from state n=4 to n=2.
The expression of resultant energy is,
ΔE=Ef−Ei (1)
The expression of energy of hydrogen given by Bohr is,
En=−2.178×10⁻¹⁸ (Z2n2) J (2)
The energy of green color transition from state n=4 to n=2 using expression (1) and (2) is calculated,
ΔE=E2−E1=[−2.178×10⁻¹⁸ (1222)]−[−2.178×10⁻¹⁸ (1242)]=−4.09×10⁻¹⁹ J
The negative sign suggests that energy is lost during state transition which means that atom becomes more stable.
The expression of change in energy with respect to wavelength:
ΔE=hcλλ=hcΔE
Substitute the value of ΔE, h and c in above expression.
λ=6.626×10⁻³⁴ J⋅s×3×10⁸ m/s4.09×10−19 J=4.86×10⁻⁷ m
It is clear from the above calculated value of wavelength that green light is in visible spectrum. Hence, color given in this transition is correct.
(d)
Interpretation:
The reason is to be given with mathematical support that energy levels get closer together as they increase. Also the colours given in the diagram is to be checked.
Concept introduction:
The energy level diagram is simply a spectral line which gives the specific amount of energy for transition of energy levels.
To determine: The correctness of blue color transition given in the diagram with mathematical support.
Answer to Problem 28Q
Answer
The blue color transition is correct.
Explanation of Solution
The diagram below shows the transition state from high to low:
Consider the blue color transition from state n=5 to n=2.
The expression of resultant energy is:
ΔE=Ef−Ei (1)
The expression of energy of hydrogen given by Bohr is,
En=−2.178×10⁻¹⁸ (Z2n2) J (2)
The energy of blue color transition from state n=5 to n=2 using expression (1) and (2) is calculated,
ΔE=E2−E1=[−2.178×10⁻¹⁸ (1222)]−[−2.178×10⁻¹⁸ (1252)]=−4.58×10⁻¹⁹ J
The negative sign suggests that energy is lost during state transition which means that atom becomes more stable.
The expression of change in energy with respect to wavelength:
ΔE=hcλλ=hcΔE
Substitute the value of ΔE, h and c in above expression.
λ=6.626×10⁻³⁴ J⋅s×3×10⁸ m/s4.58×10−19 J=4.34×10⁻⁷ m
It is clear from the above calculated value of wavelength that blue light is in visible spectrum. Hence, color given in this transition is correct.
Want to see more full solutions like this?
Chapter 7 Solutions
Bundle: Chemistry, 10th + Laboratory Handbook for General Chemistry, 3rd + Student Resource Center Printed Access Card + Student Solutions Manual for ... Access Card for Zumdahl/Zumdahl/DeCoste


- Reaction A 0,0arrow_forwardpresented by Morillon Leaning Predict the organic product for the min кусур HSC Adithane carved arnown to come than that to the condon slchroruis in acid in in aquishri with ноюarrow_forward6.15PM Sun Mar 30 K Draw the major product of this reaction. Include any relevant stereochemistry. Ignore inorganic byproducts. Problem 1 of O H [PhзPCH2CH3]*C|¯ NaH Drawing > Q Atoms, Bonds and Draw or tap a nearrow_forward
- 8:17 PM Sun Mar 30 Draw the major product of this reaction. Ignore inorganic byproducts. HSCH2CH2CH2SH, BF3 Probler Drawing Ato Bonds Clarrow_forwardpresented by Mr L How the coprion. (Il Done in no wraction, dew the starting redential) доarrow_forward8:16 PM Sun Mar 30 K Draw the major product of this reaction. Ignore inorganic byproducts. Proble 1. CH3MgBr 2. H3O+ F Drawingarrow_forward
- о но оarrow_forwardName the major organic product of the following action of 4-chloro-4-methyl-1-pentanol in neutral pollution 10+ Now the product. The product has a molecular formula f b. In a singly hain, the starting, material again converts into a secule with the molecular kormula CIO. but with comply Draw the major organic structure inhalationarrow_forwardMacmillan Learning Alcohols can be oxidized by chromic acid derivatives. One such reagent is pyridinium chlorochromate, (C,H,NH*)(CICTO3), commonly known as PCC. Draw the proposed (neutral) intermediate and the organic product in the oxidation of 1-butanol by PCC when carried out in an anhydrous solvent such as CH₂C₁₂. PCC Intermediate OH CH2Cl2 Draw the intermediate. Select Draw Templates More с H Cr о Product Draw the product. Erase Select Draw Templates More H о Erasearrow_forward
- If I have 1-bromopropene, to obtain compound A, I have to add NaOH and another compound. Indicate which compound that would be. A C6H5 CH3arrow_forwardProvide the reagents for the following reactions.arrow_forwardIf I have 1-bromopropene, to obtain compound Z, I have to add two compounds A1 and A2. Indicate which compounds are needed. P(C6H5)3arrow_forward
 Physical ChemistryChemistryISBN:9781133958437Author:Ball, David W. (david Warren), BAER, TomasPublisher:Wadsworth Cengage Learning,
 World of Chemistry, 3rd editionChemistryISBN:9781133109655Author:Steven S. Zumdahl, Susan L. Zumdahl, Donald J. DeCostePublisher:Brooks / Cole / Cengage Learning
 Chemistry: Principles and PracticeChemistryISBN:9780534420123Author:Daniel L. Reger, Scott R. Goode, David W. Ball, Edward MercerPublisher:Cengage Learning
 Principles of Modern ChemistryChemistryISBN:9781305079113Author:David W. Oxtoby, H. Pat Gillis, Laurie J. ButlerPublisher:Cengage Learning
 Chemistry: Principles and ReactionsChemistryISBN:9781305079373Author:William L. Masterton, Cecile N. HurleyPublisher:Cengage Learning
 ChemistryChemistryISBN:9781305957404Author:Steven S. Zumdahl, Susan A. Zumdahl, Donald J. DeCostePublisher:Cengage Learning