
Concept explainers
Videos
EXERCISES
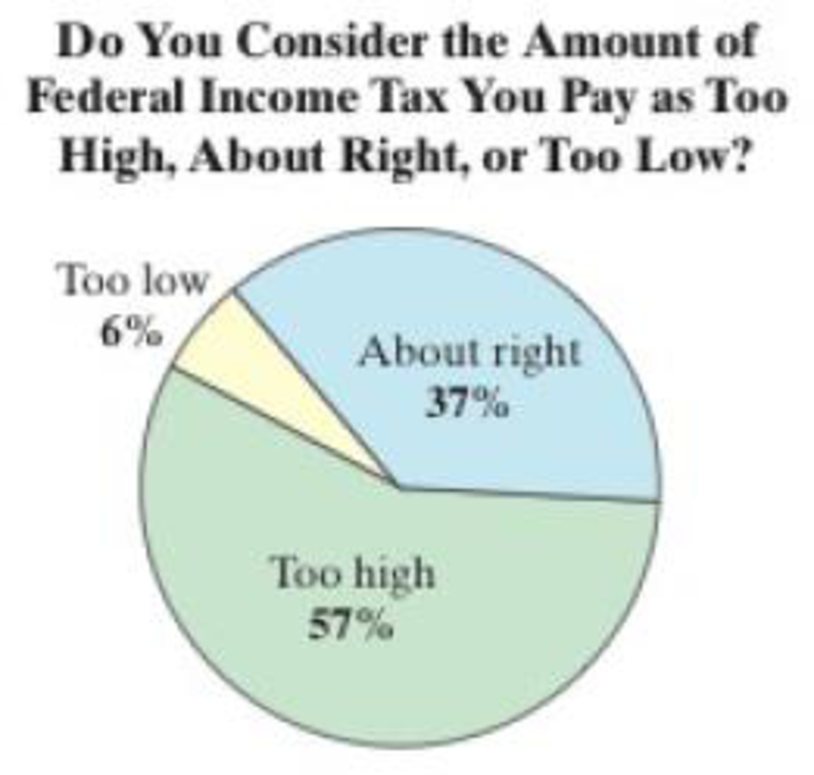
In Exercises 1–3, assume that you work for the Internal Revenue Service. You are asked to write a report about the claim that 57% of U.S. adults think the amount of federal income tax they pay is too high. (Source: Gallup)
- 1. What is the null hypothesis in this situation? Describe how your report could be incorrect by trying to prove the null hypothesis.
- 2. Describe how your report could make a type I error.
- 3. Describe how your report could make a type II error.
To state: The null hypothesis in the given situation and describe how the report could be incorrect by trying to prove the null hypothesis.
Answer to Problem 1UA
The null hypothesis in the given situation is,
When type error is present, the report could be incorrect by trying to prove the null hypothesis.
Explanation of Solution
Null hypothesis:
Null hypothesis is a statement about the population parameter. Its value is equal to the claim value, which is denoted by
Alternative hypothesis:
It is complementary to the null hypothesis. That is, it differs from the null hypothesis. The possible symbols used in the alternative hypothesis would be <,>, or ≠. It is denoted by
Here, the claim is that, “57% of U.S adults think the amount of federal income tax they pay is too high”. This can be written as
Null hypothesis:
Type I error: Rejecting the null hypothesis, when it is actually true.
Type II error: Failing to reject the null hypothesis, when it is false.
A type I error occurs when the hypothesis test indicates that the percentage of U.S. adults think the amount of federal income tax they pay is too high is not 57%; but in reality, the percentage of U.S. adults think the amount of federal income tax they pay is too high is 57%. Thus, the report could be incorrect by trying to prove the null hypothesis when the type error I is present.
Want to see more full solutions like this?
Chapter 7 Solutions
Elementary Statistics: Picturing the World, Books a la Carte Edition (7th Edition)


- 9. The concentration function of a random variable X is defined as Qx(h) = sup P(x ≤ X ≤x+h), h>0. Show that, if X and Y are independent random variables, then Qx+y (h) min{Qx(h). Qr (h)).arrow_forward10. Prove that, if (t)=1+0(12) as asf->> O is a characteristic function, then p = 1.arrow_forward9. The concentration function of a random variable X is defined as Qx(h) sup P(x ≤x≤x+h), h>0. (b) Is it true that Qx(ah) =aQx (h)?arrow_forward
- 3. Let X1, X2,..., X, be independent, Exp(1)-distributed random variables, and set V₁₁ = max Xk and W₁ = X₁+x+x+ Isk≤narrow_forward7. Consider the function (t)=(1+|t|)e, ER. (a) Prove that is a characteristic function. (b) Prove that the corresponding distribution is absolutely continuous. (c) Prove, departing from itself, that the distribution has finite mean and variance. (d) Prove, without computation, that the mean equals 0. (e) Compute the density.arrow_forward1. Show, by using characteristic, or moment generating functions, that if fx(x) = ½ex, -∞0 < x < ∞, then XY₁ - Y2, where Y₁ and Y2 are independent, exponentially distributed random variables.arrow_forward
- 1. Show, by using characteristic, or moment generating functions, that if 1 fx(x): x) = ½exarrow_forward1990) 02-02 50% mesob berceus +7 What's the probability of getting more than 1 head on 10 flips of a fair coin?arrow_forward9. The concentration function of a random variable X is defined as Qx(h) sup P(x≤x≤x+h), h>0. = x (a) Show that Qx+b(h) = Qx(h).arrow_forward
- Suppose that you buy a lottery ticket, and you have to pick six numbers from 1 through 50 (repetitions allowed). Which combination is more likely to win: 13, 48, 17, 22, 6, 39 or 1, 2, 3, 4, 5, 6? barrow_forward2 Make a histogram from this data set of test scores: 72, 79, 81, 80, 63, 62, 89, 99, 50, 78, 87, 97, 55, 69, 97, 87, 88, 99, 76, 78, 65, 77, 88, 90, and 81. Would a pie chart be appropriate for this data? ganizing Quantitative Data: Charts and Graphs 45arrow_forward10 Meteorologists use computer models to predict when and where a hurricane will hit shore. Suppose they predict that hurricane Stat has a 20 percent chance of hitting the East Coast. a. On what info are the meteorologists basing this prediction? b. Why is this prediction harder to make than your chance of getting a head on your next coin toss? U anoiaarrow_forward
 Holt Mcdougal Larson Pre-algebra: Student Edition...AlgebraISBN:9780547587776Author:HOLT MCDOUGALPublisher:HOLT MCDOUGAL
 College Algebra (MindTap Course List)AlgebraISBN:9781305652231Author:R. David Gustafson, Jeff HughesPublisher:Cengage Learning
 Glencoe Algebra 1, Student Edition, 9780079039897...AlgebraISBN:9780079039897Author:CarterPublisher:McGraw Hill