
Concept explainers
Videos
(a)
To Draw: the two typical curves
To define: A Riemann sum that approximates the area between the two typical curves with drawing of the corresponding approximating rectangles and exact area between the two typical curves and the expression for the exact area.
(a)
Explanation of Solution
Consider the two curves
Here, the top curve function is
Assume f and g are continuous function and
Here, the lower limit is a and the upper limit is b.
Show the approximate ith strip rectangle with base
Sketch the two typical curves
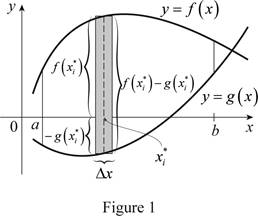
Refer to figure 1.
The two typical curves
The expression for the exact area is
Divide the area between the two typical curves into n strips of equal width and take the entire sample points to be right endpoints, in which
Sketch thecorresponding approximating rectangles as shown in Figure 2.
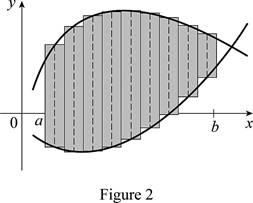
The better and better approximation occurs in
Thus, the Riemann sum with the sketch of corresponding approximating rectangles and the exact area between the two typical curves shown.
Therefore, the approximation of the area between the two typical curves using Riemann sum with the sketch of the corresponding approximating rectangles and the sum of the areas corresponding approximating rectangles is the exact area.
(b)
To Draw: The two typical curves with the changing the situation as
To define: The situation if the curves changes from
The expression for the exact area is
(b)
Explanation of Solution
Consider the two curves
Here, the right curve function is
Assume f and g are continuous function and
Here, the bottom limit is c and the top limit is d.
Sketch the two typical curves
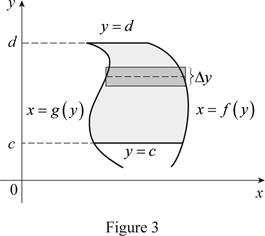
Thus, the two typical curves
Normally the height calculated from the top function minus bottom one and integrating from left to right. Instead of normal calculation, use “right minus left” and integrating from bottom to top. Therefore the exact area, A written as
Therefore, the changes of the situation if the curves have equations
Want to see more full solutions like this?
Chapter 7 Solutions
EBK WEBASSIGN FOR STEWART'S ESSENTIAL C


- Which sign makes the statement true? 9.4 × 10² 9.4 × 101arrow_forwardDO these math problems without ai, show the solutions as well. and how you solved it. and could you do it with in the time spandarrow_forwardThe Cartesian coordinates of a point are given. (a) (-8, 8) (i) Find polar coordinates (r, 0) of the point, where r > 0 and 0 ≤ 0 0 and 0 ≤ 0 < 2π. (1, 0) = (r. = ([ (ii) Find polar coordinates (r, 8) of the point, where r < 0 and 0 ≤ 0 < 2π. (5, 6) = =([arrow_forward
- The Cartesian coordinates of a point are given. (a) (4,-4) (i) Find polar coordinates (r, e) of the point, where r > 0 and 0 0 and 0 < 0 < 2π. (r, 6) = X 7 (ii) Find polar coordinates (r, 8) of the point, where r < 0 and 0 0 < 2π. (r, 0) = Xarrow_forwardr>0 (r, 0) = T 0 and one with r 0 2 (c) (9,-17) 3 (r, 8) (r, 8) r> 0 r<0 (r, 0) = (r, 8) = X X X x x Warrow_forward74. Geometry of implicit differentiation Suppose x and y are related 0. Interpret the solution of this equa- by the equation F(x, y) = tion as the set of points (x, y) that lie on the intersection of the F(x, y) with the xy-plane (z = 0). surface Z = a. Make a sketch of a surface and its intersection with the xy-plane. Give a geometric interpretation of the result that dy dx = Fx F χ y b. Explain geometrically what happens at points where F = 0. yarrow_forward
- Example 3.2. Solve the following boundary value problem by ADM (Adomian decomposition) method with the boundary conditions მი მი z- = 2x²+3 дг Əz w(x, 0) = x² - 3x, θω (x, 0) = i(2x+3). ayarrow_forward6. A particle moves according to a law of motion s(t) = t3-12t2 + 36t, where t is measured in seconds and s is in feet. (a) What is the velocity at time t? (b) What is the velocity after 3 s? (c) When is the particle at rest? (d) When is the particle moving in the positive direction? (e) What is the acceleration at time t? (f) What is the acceleration after 3 s?arrow_forwardConstruct a table and find the indicated limit. √√x+2 If h(x) = then find lim h(x). X-8 X-8 Complete the table below. X 7.9 h(x) 7.99 7.999 8.001 8.01 8.1 (Type integers or decimals rounded to four decimal places as needed.)arrow_forward
- Use the graph to find the following limits. (a) lim f(x) (b) lim f(x) X-1 x→1 (a) Find lim f(x) or state that it does not exist. Select the correct choice X-1 below and, if necessary, fill in the answer box within your choice. OA. lim f(x) = X-1 (Round to the nearest integer as needed.) OB. The limit does not exist. Qarrow_forwardOfficials in a certain region tend to raise the sales tax in years in which the state faces a budget deficit and then cut the tax when the state has a surplus. The graph shows the region's sales tax in recent years. Let T(x) represent the sales tax per dollar spent in year x. Find the desired limits and values, if they exist. Note that '01 represents 2001. Complete parts (a) through (e). Tax (in cents) T(X)4 8.5 8- OA. lim T(x)= cent(s) X-2007 (Type an integer or a decimal.) OB. The limit does not exist and is neither ∞ nor - ∞. Garrow_forwardDecide from the graph whether each limit exists. If a limit exists, estimate its value. (a) lim F(x) X➡-7 (b) lim F(x) X-2 (a) What is the value of the limit? Select the correct choice below and, if necessary, fill in the answer box within your choice. OA. lim F(x) = X-7 (Round to the nearest integer as needed.) OB. The limit does not exist. 17 Garrow_forward
 Algebra & Trigonometry with Analytic GeometryAlgebraISBN:9781133382119Author:SwokowskiPublisher:Cengage
 Trigonometry (MindTap Course List)TrigonometryISBN:9781337278461Author:Ron LarsonPublisher:Cengage Learning

 College Algebra (MindTap Course List)AlgebraISBN:9781305652231Author:R. David Gustafson, Jeff HughesPublisher:Cengage Learning
 Functions and Change: A Modeling Approach to Coll...AlgebraISBN:9781337111348Author:Bruce Crauder, Benny Evans, Alan NoellPublisher:Cengage Learning