
Calculate the average pressure at the bottom of the women’s high-heeled dress shoe and a women’s athletic walking shoe.
Answer to Problem 15P
The average pressure at the bottom of the women’s high-heeled dress shoe is
The average pressure at the bottom of the women’s athletic walking shoe is
Explanation of Solution
Given information:
Weight of the women is
Calculation:
The weight of the women is carried by both shoes. Hence, the weight (Force) acting on each shoe is as follows:
Sketch the profile of high-heeled dress shoe in inches as shown in Figure 1.
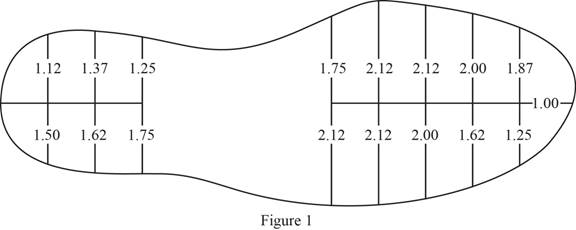
Refer to Figure 1.
The profile of contact area is divided into two equal parts and each part is divided into 8 trapezoids of equal heights.
Consider the area of top portion as
Apply trapezoidal rule as shown below.
Calculate the area of top portion
Calculate the area of bottom portion
Calculate the total area of high-heeled dress shoe as shown below.
Substitute
Calculate the average pressure at the bottom of high-heeled dress shoe as shown below.
Substitute
Hence, the average pressure at the bottom of the women’s high-heeled dress shoe is
Sketch the profile of athletic walking shoe in inches as shown in Figure 2.
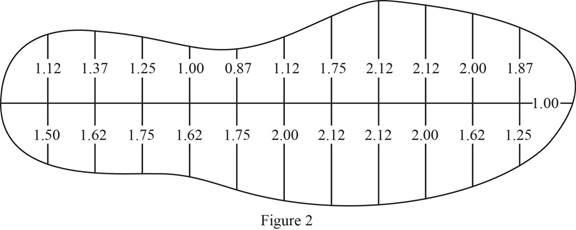
Refer to Figure 2.
The profile of contact area is divided into two equal parts and each part is divided into 12 trapezoids of equal heights.
Consider the area of top portion as
Calculate the area of top portion
Calculate the area of bottom portion
Calculate the total area of athletic walking shoe as shown below.
Substitute
Calculate the average pressure at the bottom of athletic walking shoe as shown below.
Substitute
Therefore, the average pressure at the bottom of the women’s athletic walking shoe is
Want to see more full solutions like this?
Chapter 7 Solutions
Engineering Fundamentals: An Introduction to Engineering (MindTap Course List)

- 3. EI is constant in the beam below (a = 10 ft, b = 5 ft, E = 29,000 ksi, I = 340 in (W14x34), Mo = 50 k. ft): Mo Mo a. Sketch the deflected shape. X2 b. Determine the equations of the slope and the elastic curve using the coordinates x1 and x2. Due to symmetry, only the left side is sufficient. Hint: symmetry requires the slope to be zero at mid span. c. Determine the maximum deflection. d. Specify the slope (in radians) at point A.arrow_forward2. EI is constant in the beam below (L = 10 ft, E = 29,000 ksi, I = 350 in (W12x45), W = 500 lb/ft): a. Sketch the deflected shape. b. Determine the equations of the slope and the elastic curve using the coordinates x1 and X2. c. Specify the slope (in radians) and deflection at point C. d. Specify the slope (in radians) at point B. -x- L 2 W C X27 L 22 Barrow_forwardRead the paper of Khalili et al. (2004). Describe the issue raised by Jennings and Burland in using the single-value effective stress to quantify the problem of wetting-induced collapse. Use the discussion in Khalili et al. (2004) on the different ways that effective stress and yield stress change with suction to explain how wetting-induced collapse can be modeled with the single-valued effective stress. Comment on whether the soil tested by Jotisankasa (2003) would be collapsible based on the discussionarrow_forward
- Find all the values in the bullet points in MPa.arrow_forwardhelp me with line search method in A.3arrow_forward1. A W10x60 with sections properties shown is to be used as a column. If the unsupported length is 5.0m, find the Safe Axial Load that can be carried by the section. Use Fy=248 MPa and K=1.50 (35pts) Section Properties: A = 11355 mm2 Ix = 142x106 mm4 rx = 111.51 mm Iy = 48 x 106 mm4 ry = 65.28 mm 2. A Steel Column will be required to carry a total load of 500KN. If a tubular section will be utilized and the required dimension must not exceed 400x400, what will be the required thickness of the section (tf=tw). Use Fy=248 MPa L=4.5m, K=1.0 and 80% of initial fa will be used. (50pts) Note: Plate thickness available are: 2mm, 3mm, 4mm, 6mm, 8mm and 10mm 3. A steel tension rod will be subjected to a tension load of 320 KN. What will be the required diameter of the rod if Fy=248 MPa (15pts)arrow_forward
- for purposes of orientation every contour may must display what?arrow_forwardDuring calibration of an LVDT, the data shown in the accompanying table were obtained. Using a spreadsheetprogram, plot the relation between the micrometer reading and voltage. What is the linear range of the LVDT? Determinethe calibration factor of the LVDT by obtaining the best fit line of the data within the linear range.arrow_forwardDevelop a signal design and timing for the intersection shown in the figure below. In each case accommodate both vehicular and pedestrian movements. In general, use the following values for the problem: pedestrian walking speed = 1 [m/s], vehicle deceleration = 3 [m/s²], driver reaction time = 1.5 [s], length of vehicle = 6 [m], and level grade = 0. If you need to assume other variables and parameters to solve this problem clearly state that in your report and explain the reason. A250 1100 One-way Speed limit = 50 [km/h] Pedestrian = 15 per each crosswalk Crosswalk widths = 3 [m] Lane width = 4 [m] Saturation flow = 1800 [veh/h/lane] 1100 ↑ 200 70 80 900arrow_forward
 Engineering Fundamentals: An Introduction to Engi...Civil EngineeringISBN:9781305084766Author:Saeed MoaveniPublisher:Cengage Learning
 Solid Waste EngineeringCivil EngineeringISBN:9781305635203Author:Worrell, William A.Publisher:Cengage Learning,
 Principles of Geotechnical Engineering (MindTap C...Civil EngineeringISBN:9781305970939Author:Braja M. Das, Khaled SobhanPublisher:Cengage Learning
 Fundamentals of Geotechnical Engineering (MindTap...Civil EngineeringISBN:9781305635180Author:Braja M. Das, Nagaratnam SivakuganPublisher:Cengage Learning
 Principles of Foundation Engineering (MindTap Cou...Civil EngineeringISBN:9781305081550Author:Braja M. DasPublisher:Cengage Learning
 Fundamentals Of Construction EstimatingCivil EngineeringISBN:9781337399395Author:Pratt, David J.Publisher:Cengage,