
Concept explainers
Videos
Scores from a questionnaire measuring social anxiety form a
- a. for a random sample of n = 4 people?
- b. for a random sample of n = 16 people?
- c. for a random sample of n = 25 people?
a.
Answer to Problem 11P
The probability of obtaining a sample mean greater than
Explanation of Solution
Given info:
Numbers of people in a random sample are
Population mean is
Population standard deviation is
Sample mean is
Calculation:
If
Let
Let p represents the probability that random mean is greater than
Software procedure:
Step-by-step procedure to obtain the
- Click on first empty block of data view.
- Go to Transform>Choose Compute variable>Enter Probability in Target Variable.
- Choose CDF& Noncentral CDF under Function group> choose CDF.Normal> drag it to the numeric expression.
- Enter 53,50,5 in the braces of CDF.NORMAL
- Choose OK.
Output using the SPSS software is given below:
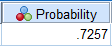
From the SPSS output,
Using
Thus, the probability of obtaining a mean greater than
b.
Answer to Problem 11P
The probability of obtaining a sample mean greater than
Explanation of Solution
Given info:
Numbers of people in a random sample are
Population mean is
Population standard deviation is
Sample mean is
Calculation:
If
Let
Let p represents the probability that random mean is greater than
Software procedure:
Step-by-step procedure to obtain the
- Click on first empty block of data view.
- Go to Transform>Choose Compute variable>Enter Probability in Target Variable.
- Choose CDF& Noncentral CDF under Function group> choose CDF.Normal> drag it to the numeric expression.
- Enter 53,50,2.5 in the braces of CDF.NORMAL
- Choose OK.
Output using the SPSS software is given below:
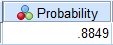
From the SPSS output,
Thus,
Hence, the probability of obtaining a mean greater than
c.
Answer to Problem 11P
The probability of obtaining a sample mean greater than
Explanation of Solution
Given info:
Numbers of people in a random sample are
Population mean is
Population standard deviation is
Sample mean is
Calculation:
If
Let
Let p represents the probability that random mean is greater than
Software procedure:
Step-by-step procedure to obtain the
- Click on first empty block of data view.
- Go to Transform>Choose Compute variable>Enter Probability in Target Variable.
- Choose CDF& Noncentral CDF under Function group> choose CDF.Normal> drag it to the numeric expression.
- Enter 53,50,2 in the braces of CDF.NORMAL
- Choose OK.
Output using the SPSS software is given below:
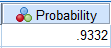
From the SPSS output,
Thus,
Hence, the probability of obtaining a mean greater than
Want to see more full solutions like this?
Chapter 7 Solutions
Essentials of Statistics for The Behavioral Sciences (MindTap Course List)


- Question 6: Negate the following compound statements, using De Morgan's laws. A) If Alberta was under water entirely then there should be no fossil of mammals.arrow_forwardNegate the following compound statement using De Morgans's laws.arrow_forwardCharacterize (with proof) all connected graphs that contain no even cycles in terms oftheir blocks.arrow_forward
- Let G be a connected graph that does not have P4 or C3 as an induced subgraph (i.e.,G is P4, C3 free). Prove that G is a complete bipartite grapharrow_forwardProve sufficiency of the condition for a graph to be bipartite that is, prove that if G hasno odd cycles then G is bipartite as follows:Assume that the statement is false and that G is an edge minimal counterexample. That is, Gsatisfies the conditions and is not bipartite but G − e is bipartite for any edge e. (Note thatthis is essentially induction, just using different terminology.) What does minimality say aboutconnectivity of G? Can G − e be disconnected? Explain why if there is an edge between twovertices in the same part of a bipartition of G − e then there is an odd cyclearrow_forwardLet G be a connected graph that does not have P4 or C4 as an induced subgraph (i.e.,G is P4, C4 free). Prove that G has a vertex adjacent to all othersarrow_forward
- We consider a one-period market with the following properties: the current stock priceis S0 = 4. At time T = 1 year, the stock has either moved up to S1 = 8 (with probability0.7) or down towards S1 = 2 (with probability 0.3). We consider a call option on thisstock with maturity T = 1 and strike price K = 5. The interest rate on the money marketis 25% yearly.(a) Find the replicating portfolio (φ, ψ) corresponding to this call option.(b) Find the risk-neutral (no-arbitrage) price of this call option.(c) We now consider a put option with maturity T = 1 and strike price K = 3 onthe same market. Find the risk-neutral price of this put option. Reminder: A putoption gives you the right to sell the stock for the strike price K.1(d) An investor with initial capital X0 = 0 wants to invest on this market. He buysα shares of the stock (or sells them if α is negative) and buys β call options (orsells them is β is negative). He invests the cash balance on the money market (orborrows if the amount is…arrow_forwardDetermine if the two statements are equivalent using a truth tablearrow_forwardQuestion 4: Determine if pair of statements A and B are equivalent or not, using truth table. A. (~qp)^~q в. р л~9arrow_forward
- Determine if the two statements are equalivalent using a truth tablearrow_forwardQuestion 3: p and q represent the following simple statements. p: Calgary is the capital of Alberta. A) Determine the value of each simple statement p and q. B) Then, without truth table, determine the va q: Alberta is a province of Canada. for each following compound statement below. pvq р^~q ~рл~q ~q→ p ~P~q Pq b~ (d~ ← b~) d~ (b~ v d) 0 4arrow_forward2. Let X be a random variable. (a) Show that, if E X2 = 1 and E X4arrow_forwardarrow_back_iosSEE MORE QUESTIONSarrow_forward_ios
 Glencoe Algebra 1, Student Edition, 9780079039897...AlgebraISBN:9780079039897Author:CarterPublisher:McGraw Hill