
Concept explainers
Videos
The running time for videos submitted to YouTube in a given week is
- If a single video is randomly selected, what is the
probability that the running time of the video exceeds 6 minutes (360 seconds)? - Suppose that a sample of 40 videos is selected. What is the probability that the
mean running time of the sample exceeds 6 minutes?
(a)
To find:the probability that the running time of the video exceeds 6 minutes (
If a single video is randomly selected,
Answer to Problem 11CQ
The required answer is
Explanation of Solution
Given,
If a single video is randomly selected then the mean of
Calculation Required:
The required probability that
Using normal table,
Calculation Steps:
Given that a normal distribution has mean of
If a single video is randomly selected then the mean of
The standard deviation is,
To compute the probability that
1. Click CaIc, then select Probability distributions and then go to Normal.
2. Select the Cumulative option.
3. Enter
4. Enter
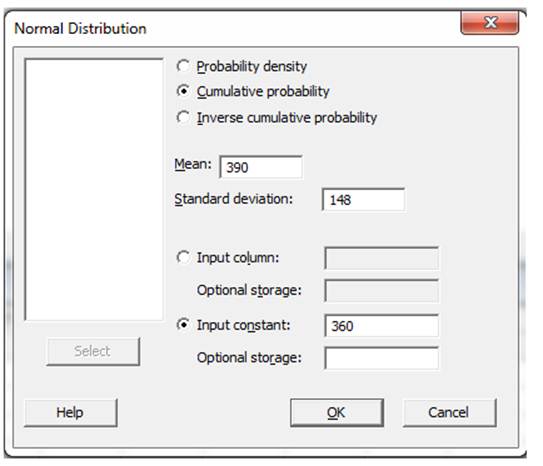
5. Click Ok. The final output is given below.
Cumulative distribution function.
Normal with mean
The required probability that
The required answer is
(b)
To find: the probability that the mean running time of the sample exceeds
Answer to Problem 11CQ
The required answer is
Explanation of Solution
Given,
If
Calculation Required:
Using normal table,
Calculation Steps :
If
The standard deviation is,
The final output is given below.
The final output is given below.
Cumulative distribution function
Normal with mean
The required probability that
The required answer is
Want to see more full solutions like this?
Chapter 7 Solutions
Elementary Statistics (Text Only)


- Show all workarrow_forwardplease find the answers for the yellows boxes using the information and the picture belowarrow_forwardA marketing agency wants to determine whether different advertising platforms generate significantly different levels of customer engagement. The agency measures the average number of daily clicks on ads for three platforms: Social Media, Search Engines, and Email Campaigns. The agency collects data on daily clicks for each platform over a 10-day period and wants to test whether there is a statistically significant difference in the mean number of daily clicks among these platforms. Conduct ANOVA test. You can provide your answer by inserting a text box and the answer must include: also please provide a step by on getting the answers in excel Null hypothesis, Alternative hypothesis, Show answer (output table/summary table), and Conclusion based on the P value.arrow_forward
- A company found that the daily sales revenue of its flagship product follows a normal distribution with a mean of $4500 and a standard deviation of $450. The company defines a "high-sales day" that is, any day with sales exceeding $4800. please provide a step by step on how to get the answers Q: What percentage of days can the company expect to have "high-sales days" or sales greater than $4800? Q: What is the sales revenue threshold for the bottom 10% of days? (please note that 10% refers to the probability/area under bell curve towards the lower tail of bell curve) Provide answers in the yellow cellsarrow_forwardBusiness Discussarrow_forwardThe following data represent total ventilation measured in liters of air per minute per square meter of body area for two independent (and randomly chosen) samples. Analyze these data using the appropriate non-parametric hypothesis testarrow_forward
 Glencoe Algebra 1, Student Edition, 9780079039897...AlgebraISBN:9780079039897Author:CarterPublisher:McGraw Hill