USING AND UNDERSTANDING MATHEMATICS W/
7th Edition
ISBN: 9780135239919
Author: BENNETT AND BR
Publisher: PEARSON
expand_more
expand_more
format_list_bulleted
Concept explainers
Videos
Textbook Question
Chapter 6.A, Problem 37E
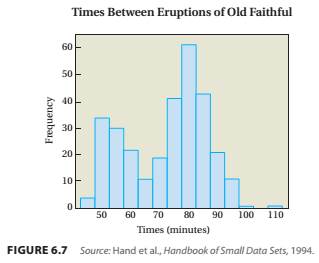
Smooth Distributions. Through each histogram, draw a smooth curve that captures its important features. Then classify the distribution according to its number of peaks, symmetry or skew-ness, and variation.
37. Times between 300 eruptions of Old Faithful geyser in Yellowstone National Park, shown in Figure 6.7
Expert Solution & Answer
Want to see the full answer?
Check out a sample textbook solution
Students have asked these similar questions
Write the negation of the definition of an injective function
Let U= {0, 1, 2, 3, 4, 5, 6, 7, 8, 9}, A = {xeU Ix is a multiple of 3}, and B = {x = UIx = 0 (mod 2)}.
Use the roster method to list all elements in each of the following sets: a) A, b) B, c) A u B, d) B – A, e) A^cn B
The function f is; Injective (only), Surjective (only), Bijective, or none? show work
Chapter 6 Solutions
USING AND UNDERSTANDING MATHEMATICS W/
Ch. 6.A - Prob. 1QQCh. 6.A - On an astronomy exam, 20 students score below 79...Ch. 6.A - One hundred students take a chemistry exam. All...Ch. 6.A - Twenty students take a political science exam....Ch. 6.A - A survey asks students to state many sodas they...Ch. 6.A - Among professional actors, a small number of...Ch. 6.A - The distribution of wages at a company is...Ch. 6.A - Compared to a distribution with a broad central...Ch. 6.A - If you compared the distribution of weights of 20...Ch. 6.A - The mayor of a town is considering a run for...
Ch. 6.A - 1. Define and distinguish among mean, median, and...Ch. 6.A - Prob. 2ECh. 6.A - Briefly describe at least two possible sources of...Ch. 6.A - Prob. 4ECh. 6.A - Prob. 5ECh. 6.A - Prob. 6ECh. 6.A - In my data set of 10 exam scores, the mean turned...Ch. 6.A - In my data set of 10 exam scores, the median...Ch. 6.A - I made a distribution of 15 apartment rents in my...Ch. 6.A - Two extremely tall people skewed the distribution...Ch. 6.A - The distribution of grades was left-skewed, but...Ch. 6.A - There’s much more variation in the ages of the...Ch. 6.A - 13-18: Mean, Median, and Mode. Compute the mean,...Ch. 6.A - Mean, Median, and Mode. Compute the mean, median,...Ch. 6.A - Mean, Median, and Mode. Compute the mean, median,...Ch. 6.A - Mean, Median, and Mode. Compute the mean, median,...Ch. 6.A - 13–18: Mean, Median, and Mode. Compute the mean,...Ch. 6.A - 13-18: Mean, Median, and Mode. Compute the mean,...Ch. 6.A - Outlier Coke. Cans of Coca-Cola vary slightly in...Ch. 6.A - 20. Margin of Victory. The following data give the...Ch. 6.A - Appropriate Average. For each of the following...Ch. 6.A - 21-26: Appropriate Average. For each of the...Ch. 6.A - 21-26: Appropriate Average. For each of the...Ch. 6.A - 21-26: Appropriate Average. For each of the...Ch. 6.A - 21-26: Appropriate Average. For each of the...Ch. 6.A - 21-26: Appropriate Average. For each of the...Ch. 6.A - 27-34: Describing Distributions Consider the...Ch. 6.A - Describing Distributions. Consider the following...Ch. 6.A - 27-34: Describing Distributions Consider the...Ch. 6.A - Describing Distributions. Consider the following...Ch. 6.A - 27-34: Describing Distributions Consider the...Ch. 6.A - Describing Distributions. Consider the following...Ch. 6.A - Prob. 33ECh. 6.A - Describing Distributions. Consider the following...Ch. 6.A - Prob. 35ECh. 6.A - 35-36: Understanding Distributions. For the given...Ch. 6.A - Smooth Distributions. Through each histogram, draw...Ch. 6.A - Smooth Distributions. For each histogram, draw a...Ch. 6.A - Smooth Distributions. For each histogram, draw a...Ch. 6.A - Prob. 40ECh. 6.A - Family Income. Suppose you study family income in...Ch. 6.A - Airline Delays. Suppose you are a scheduler for a...Ch. 6.A - Weighted Means. We often deal with weighted means,...Ch. 6.A - Weighted Means. We often deal with weighted means,...Ch. 6.A - Prob. 45ECh. 6.A - Prob. 46ECh. 6.A - Prob. 47ECh. 6.A - Prob. 48ECh. 6.A - 50. Daily Averages. Cite three examples of...Ch. 6.A - 51. Distributions in the News. Find three recent...Ch. 6.A - Answer the following questions using procedures...Ch. 6.A - Prob. 52ECh. 6.A - 53. StatCrunch Project. Choose a data set...Ch. 6.B - The lowest score on an exam was 62, the median...Ch. 6.B - Which of the following is not part of a...Ch. 6.B - The lower quartile for hourly wages at a coffee...Ch. 6.B - Is it possible for a distribution to have a mean...Ch. 6.B - Suppose you are given the mean and just one data...Ch. 6.B - The standard deviation is best described as a...Ch. 6.B - What type of data distribution has a negative...Ch. 6.B - In any distribution, it is always true that a. the...Ch. 6.B - Which data set would you expect to have the...Ch. 6.B - Professors Smith, Jones, and Garcia all got the...Ch. 6.B - Consider two grocery stores at which the mean time...Ch. 6.B - Describe how we define and calculate the range of...Ch. 6.B - Prob. 3ECh. 6.B - Prob. 4ECh. 6.B - Prob. 5ECh. 6.B - Prob. 6ECh. 6.B - The distributions of scores on two exams had the...Ch. 6.B - The highest exam score was in the upper quartile...Ch. 6.B - For the 30 students who took the test, the high...Ch. 6.B - I examined the data carefully, and the range was...Ch. 6.B - The standard deviation for the heights of a group...Ch. 6.B - The mean gas mileage of the compact cars we tested...Ch. 6.B - 13. Big Bank Verification. Find the mean and...Ch. 6.B - Prob. 14ECh. 6.B - Comparing Variations. Consider the following data...Ch. 6.B - Prob. 16ECh. 6.B - Prob. 17ECh. 6.B - Comparing Variations. Consider the following data...Ch. 6.B - Understanding Variation. The following exercises...Ch. 6.B - Understanding Variation. The following exercises...Ch. 6.B - Pizza Deliveries. After recording the pizza...Ch. 6.B - Airline Arrival Times. Two airlines have data on...Ch. 6.B - 23. Portfolio Standard Deviation. The book...Ch. 6.B - Defect Rates. Two factories each produce 1000...Ch. 6.B - 25. Ice Cream Deviations. Each night you total the...Ch. 6.B - Vet Data. A small animal veterinarian reviews her...Ch. 6.B - Prob. 27ECh. 6.B - Prob. 28ECh. 6.B - 29. Quality Control. An auto transmission...Ch. 6.B - Web Data Sets. Go to any website that gives data...Ch. 6.B - Prob. 31ECh. 6.B - Prob. 32ECh. 6.B - Prob. 33ECh. 6.B - Prob. 34ECh. 6.B - 35. Variation in StatCrunch. Load the data set...Ch. 6.B - 36. StatCrunch Project. Choose a data set...Ch. 6.C - Graphs of normal distributions a. always look...Ch. 6.C - In a normal distribution, the mean a. is equal to...Ch. 6.C - In a normal distribution, data values farther from...Ch. 6.C - Consider wages at a fast food restaurant where...Ch. 6.C - In a normal distribution, about 2/3 Of the data...Ch. 6.C - Suppose a car driven under different conditions...Ch. 6.C - Consider again the car described in Question 6. On...Ch. 6.C - Consider an exam with a normal distribution of...Ch. 6.C - An acquaintance tells you that his IQ is in the...Ch. 6.C - The height of a particular 7-year-old girl has a...Ch. 6.C - 1. What is a normal distribution? Briefly describe...Ch. 6.C - 2. What is the 68-95-99.7 rule for normal...Ch. 6.C - 3. What is a standard score? How do you find the...Ch. 6.C - Prob. 4ECh. 6.C - The heights of male basketball players at Kentucky...Ch. 6.C - The weights of babies born at Belmont Hospital are...Ch. 6.C - The weights of babies born at Belmont Hospital are...Ch. 6.C - On yesterday's mathematics exam, the standard...Ch. 6.C - My professor graded the final on a curve, and she...Ch. 6.C - Jack is the 50th percentile for height, so he is...Ch. 6.C - Prob. 11ECh. 6.C - Prob. 12ECh. 6.C - Prob. 13ECh. 6.C - 13-18: Normal Distributions. State, with an...Ch. 6.C - 13-18: Normal Distributions. State, with an...Ch. 6.C - Normal Distributions. State, with an explanation,...Ch. 6.C - Prob. 17ECh. 6.C - 13-18: Normal Distributions. State, with an...Ch. 6.C - The 68-95-99.7 Rule. A set of test scores is...Ch. 6.C - The 68-95-99.7 Rule. The resting heart rates for a...Ch. 6.C - Psychology Exam. The scores on a psychology exam...Ch. 6.C - Psychology Exam. The scores on a psychology exam...Ch. 6.C - Psychology Exam. The scores on a psychology exam...Ch. 6.C - Psychology Exam. The scores on a psychology exam...Ch. 6.C - Psychology Exam. The scores on a psychology exam...Ch. 6.C - 21-28: Psychology Exam. The scores on a psychology...Ch. 6.C - 21-28: Psychology Exam. The scores on a psychology...Ch. 6.C - Psychology Exam. The scores on a psychology exam...Ch. 6.C - Standard Scores and Percentiles. Use Table 6.3 to...Ch. 6.C - Standard Scores and Percentiles. Use Table 6.3 to...Ch. 6.C - Percentiles. Use Table 6.4 to find the approximate...Ch. 6.C - Percentiles. Use Table 6.4 to find the approximate...Ch. 6.C - Pregnancy Length. Actual lengths of terms are...Ch. 6.C - Pregnancy Length. Actual lengths of terms are...Ch. 6.C - Prob. 35ECh. 6.C - Prob. 36ECh. 6.C - Heights. According to data from the National...Ch. 6.C - Body Mass Index (BMI). The body mass indexes of...Ch. 6.C - 39. Is It Likely? Suppose you read that the...Ch. 6.C - Prob. 40ECh. 6.C - GRE Scores. Scores on the verbal Graduate Record...Ch. 6.C - 41-47: GRE Scores. Scores on the verbal section of...Ch. 6.C - 41-47: GRE Scores. Scores on the verbal section of...Ch. 6.C - Prob. 44ECh. 6.C - 41-47: GRE Scores. Scores on the verbal section of...Ch. 6.C - Prob. 46ECh. 6.C - Prob. 47ECh. 6.C - Normal Distributions. Many data sets described in...Ch. 6.C - Normal Demonstration. Do a Web search on the...Ch. 6.C - Heights of American Men. The heights of American...Ch. 6.C - Normal Distributions in StatCrunch. Go to the work...Ch. 6.C - Prob. 52ECh. 6.D - Prob. 1QQCh. 6.D - Prob. 2QQCh. 6.D - Prob. 3QQCh. 6.D - Prob. 4QQCh. 6.D - A poll finds that 35% of the people surveyed...Ch. 6.D - Prob. 6QQCh. 6.D - Consider a survey with a margin of error of 4%. If...Ch. 6.D - Prob. 8QQCh. 6.D - Prob. 9QQCh. 6.D - Prob. 10QQCh. 6.D - Prob. 1ECh. 6.D - Prob. 2ECh. 6.D - Prob. 3ECh. 6.D - Prob. 4ECh. 6.D - Prob. 5ECh. 6.D - Prob. 6ECh. 6.D - Prob. 7ECh. 6.D - Prob. 8ECh. 6.D - Prob. 9ECh. 6.D - Prob. 10ECh. 6.D - Both agencies conducted their surveys carefully,...Ch. 6.D - If you want to reduce the margin of error in your...Ch. 6.D - Prob. 13ECh. 6.D - Prob. 14ECh. 6.D - Prob. 15ECh. 6.D - Subjective Significance. For each of the following...Ch. 6.D - 15-20: Subjective Significance. For each of the...Ch. 6.D - Prob. 18ECh. 6.D - Prob. 19ECh. 6.D - 15-20: Subjective Significance. For each of the...Ch. 6.D - Human Body Temperature. A study by University of...Ch. 6.D - Seat Belts and Children. In a study of children...Ch. 6.D - SAT Preparation. A study of 75 students who took...Ch. 6.D - Weight by Age. A National Health Survey determined...Ch. 6.D - Margin of Error. Find the margin of error and the...Ch. 6.D - Prob. 26ECh. 6.D - 25-32: Margin of Error. Find the margin of error...Ch. 6.D - Prob. 28ECh. 6.D - Prob. 29ECh. 6.D - 25-32: Margin of Error. Find the margin of error...Ch. 6.D - 25-32: Margin of Error. Find the margin of error...Ch. 6.D - Margin of Error. Find the margin of error and the...Ch. 6.D - 33-38: Formulating Hypotheses. Consider the...Ch. 6.D - Prob. 34ECh. 6.D - Prob. 35ECh. 6.D - Prob. 36ECh. 6.D - Prob. 37ECh. 6.D - Prob. 38ECh. 6.D -
39-44: Hypothesis Tests. The following exercises...Ch. 6.D -
39-44: Hypothesis Tests. The following exercises...Ch. 6.D -
39-44: Hypothesis Tests. The following exercises...Ch. 6.D -
39-44: Hypothesis Tests. The following exercises...Ch. 6.D -
39-44: Hypothesis Tests. The following exercises...Ch. 6.D - Prob. 44ECh. 6.D - Prob. 45ECh. 6.D - Prob. 46ECh. 6.D - Prob. 47ECh. 6.D - Better Margin of Error. Suppose you want to...Ch. 6.D - Prob. 49ECh. 6.D - Recent Polls. Visit the websites of polling...Ch. 6.D - Prob. 51ECh. 6.D - Statistical Significance. Find a recent news...Ch. 6.D - Prob. 53ECh. 6.D - Hypothesis Testing. Find a news report describing...Ch. 6.D - 55. Confidence Interval. Go to and choose...
Knowledge Booster


Learn more about
Need a deep-dive on the concept behind this application? Look no further. Learn more about this topic, subject and related others by exploring similar questions and additional content below.Similar questions
- For each a Є Z, if a ‡0 (mod 3), then a² = 1 (mod 3).arrow_forwardfind: f(3)=? , and the set of all preimages of 2 is ?arrow_forward12:01 PM Tue May 13 < AA ✓ Educatic S s3.amazona... A Assess Your... 目 accelerate-iu15-bssd.vschool.com S s3.amazona... Trigonometric Identities Module Exam Dashboard ... Dashboard ... Algebra 2 Pa... Algebra 2 Part 4 [Honors] (Acc. Ed.) (Zimmerman) 24-25 / Module 11: Trigonometric Identities i + 38% ✰ Start Page Alexis Forsythe All changes saved 10. A sound wave's amplitude can be modeled by the function y = −7 sin ((x-1) + 4). Within the interval 0 < x < 12, when does the function have an amplitude of 4? (Select all that apply.) 9.522 seconds 4.199 seconds 0.522 seconds 1.199 seconds Previous 10 of 20 Nextarrow_forward
- Techniques QUAT6221 2025 PT B... TM Tabudi Maphoru Activities Assessments Class Progress lIE Library • Help v The table below shows the prices (R) and quantities (kg) of rice, meat and potatoes items bought during 2013 and 2014: 2013 2014 P1Qo PoQo Q1Po P1Q1 Price Ро Quantity Qo Price P1 Quantity Q1 Rice 7 80 6 70 480 560 490 420 Meat 30 50 35 60 1 750 1 500 1 800 2 100 Potatoes 3 100 3 100 300 300 300 300 TOTAL 40 230 44 230 2 530 2 360 2 590 2 820 Instructions: 1 Corall dawn to tha bottom of thir ceraan urina se se tha haca nariad in archerca antarand cubmit Q Search ENG US 口X 2025/05arrow_forwardThe table below indicates the number of years of experience of a sample of employees who work on a particular production line and the corresponding number of units of a good that each employee produced last month. Years of Experience (x) Number of Goods (y) 11 63 5 57 1 48 4 54 45 3 51 Q.1.1 By completing the table below and then applying the relevant formulae, determine the line of best fit for this bivariate data set. Do NOT change the units for the variables. X y X2 xy Ex= Ey= EX2 EXY= Q.1.2 Estimate the number of units of the good that would have been produced last month by an employee with 8 years of experience. Q.1.3 Using your calculator, determine the coefficient of correlation for the data set. Interpret your answer. Q.1.4 Compute the coefficient of determination for the data set. Interpret your answer.arrow_forwardUse the figure for Exercises 1-2. Suppose you use geometry software to construct a secant CE and tangent CD that intersect on a circle at point C. File Edit Display Construct Transform Measure Graph Window Help D 1. Suppose you measure /DCE and you measure CBE. Then you drag the points around the circle and measure the angle and arc three more times. What would you expect to find each time? Which theorem from the lesson would you be demonstrating? 2. When the measure of the intercepted arc is 180°, what is the measure of the angle? What does that tell you about the secant?arrow_forward
- Q.3.2 A sample of consumers was asked to name their favourite fruit. The results regarding the popularity of the different fruits are given in the following table. Type of Fruit Number of Consumers Banana 25 Apple 20 Orange 5 TOTAL 50 Draw a bar chart to graphically illustrate the results given in the table.arrow_forwardFor the given right triangle, the longer leg is 8 units long and the shorter leg is 6 units long. sina=arrow_forwardQ.2.3 The probability that a randomly selected employee of Company Z is female is 0.75. The probability that an employee of the same company works in the Production department, given that the employee is female, is 0.25. What is the probability that a randomly selected employee of the company will be female and will work in the Production department? Q.2.4 There are twelve (12) teams participating in a pub quiz. What is the probability of correctly predicting the top three teams at the end of the competition, in the correct order? Give your final answer as a fraction in its simplest form.arrow_forward
- Q.2.1 A bag contains 13 red and 9 green marbles. You are asked to select two (2) marbles from the bag. The first marble selected will not be placed back into the bag. Q.2.1.1 Construct a probability tree to indicate the various possible outcomes and their probabilities (as fractions). Q.2.1.2 What is the probability that the two selected marbles will be the same colour? Q.2.2 The following contingency table gives the results of a sample survey of South African male and female respondents with regard to their preferred brand of sports watch: PREFERRED BRAND OF SPORTS WATCH Samsung Apple Garmin TOTAL No. of Females 30 100 40 170 No. of Males 75 125 80 280 TOTAL 105 225 120 450 Q.2.2.1 What is the probability of randomly selecting a respondent from the sample who prefers Garmin? Q.2.2.2 What is the probability of randomly selecting a respondent from the sample who is not female? Q.2.2.3 What is the probability of randomly…arrow_forwardCan you answer this question and give step by step and why and how to get it. Can you write it (numerical method)arrow_forwardConstruct tables showing the values of alI the Dirichlet characters mod k fork = 8,9, and 10. (please show me result in a table and the equation in mathematical format.)arrow_forward
arrow_back_ios
SEE MORE QUESTIONS
arrow_forward_ios
Recommended textbooks for you
 Big Ideas Math A Bridge To Success Algebra 1: Stu...AlgebraISBN:9781680331141Author:HOUGHTON MIFFLIN HARCOURTPublisher:Houghton Mifflin Harcourt
 Glencoe Algebra 1, Student Edition, 9780079039897...AlgebraISBN:9780079039897Author:CarterPublisher:McGraw Hill
 Trigonometry (MindTap Course List)TrigonometryISBN:9781337278461Author:Ron LarsonPublisher:Cengage Learning
 Holt Mcdougal Larson Pre-algebra: Student Edition...AlgebraISBN:9780547587776Author:HOLT MCDOUGALPublisher:HOLT MCDOUGAL
 Functions and Change: A Modeling Approach to Coll...AlgebraISBN:9781337111348Author:Bruce Crauder, Benny Evans, Alan NoellPublisher:Cengage Learning
Big Ideas Math A Bridge To Success Algebra 1: Stu...
Algebra
ISBN:9781680331141
Author:HOUGHTON MIFFLIN HARCOURT
Publisher:Houghton Mifflin Harcourt
Glencoe Algebra 1, Student Edition, 9780079039897...
Algebra
ISBN:9780079039897
Author:Carter
Publisher:McGraw Hill
Trigonometry (MindTap Course List)
Trigonometry
ISBN:9781337278461
Author:Ron Larson
Publisher:Cengage Learning
Holt Mcdougal Larson Pre-algebra: Student Edition...
Algebra
ISBN:9780547587776
Author:HOLT MCDOUGAL
Publisher:HOLT MCDOUGAL
Functions and Change: A Modeling Approach to Coll...
Algebra
ISBN:9781337111348
Author:Bruce Crauder, Benny Evans, Alan Noell
Publisher:Cengage Learning
The Shape of Data: Distributions: Crash Course Statistics #7; Author: CrashCourse;https://www.youtube.com/watch?v=bPFNxD3Yg6U;License: Standard YouTube License, CC-BY
Shape, Center, and Spread - Module 20.2 (Part 1); Author: Mrmathblog;https://www.youtube.com/watch?v=COaid7O_Gag;License: Standard YouTube License, CC-BY
Shape, Center and Spread; Author: Emily Murdock;https://www.youtube.com/watch?v=_YyW0DSCzpM;License: Standard Youtube License