
a)
The marginal revenue product of labor of the 3rd worker.
a)
Answer to Problem 1FRQ
The marginal revenue product of labor of the 3rd worker is $2,250.
Explanation of Solution
As an umbrella is sold at $15, the table would represent the following data:
| Q (labor) | Q (umbrella) | Marginal product |
| 0 | 0 | 0 |
| 1 | 300 | 300 |
| 2 | 550 | 250 |
| 3 | 700 | 150 |
| 4 | 800 | 100 |
| 5 | 850 | 50 |
| 6 | 890 | 40 |
Therefore, the marginal revenue product of labor of the 3rd worker is $2,250
Introduction: A
Marginal revenue is the earning or benefit which is obtained by using an additional unit of the product or factor of production.
b)
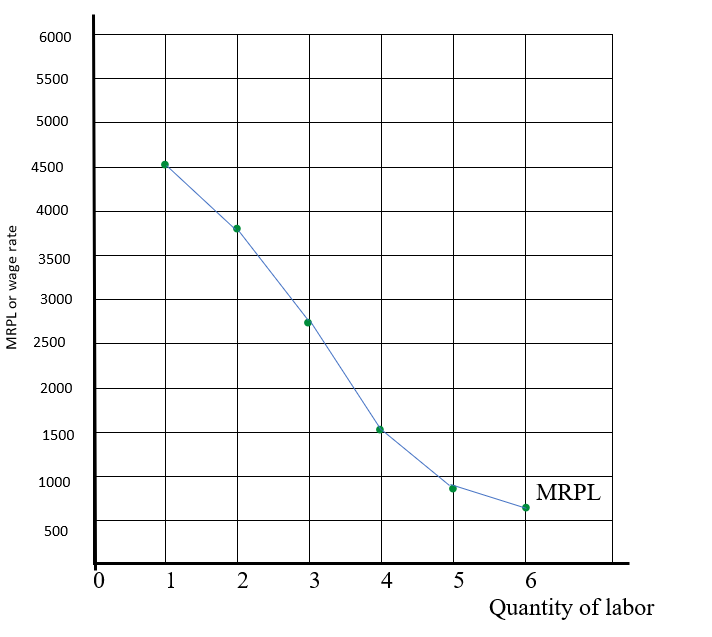
The correctly labeled graph shows the firm’s demand curve for labor.
b)
Explanation of Solution
By using a marginal product and price of $15 the MRPL would be:
| Q (labor) | Q (umbrella) | Marginal product | MRPL at $15 |
| 0 | 0 | 0 | 0 |
| 1 | 300 | 300 | 4500 |
| 2 | 550 | 250 | 3750 |
| 3 | 700 | 150 | 2250 |
| 4 | 800 | 100 | 1500 |
| 5 | 850 | 50 | 750 |
| 6 | 890 | 40 | 600 |
From the data in the table, the graph will show MRPL curve downward because by using extra units of labor, the change in total output started to decline, which makes the slope downward. And, here, the price of output is also constant at $15 by hiring more labor, which causes the demand curve to slope downward.
Therefore, the graphical presentation of data is as follows:
Introduction: A demand curve is a graphical representation that shows how sensitive demand is toward the price of a good or service.
Labor is the human capital or human resource that is the factor of production for any firm.
c)
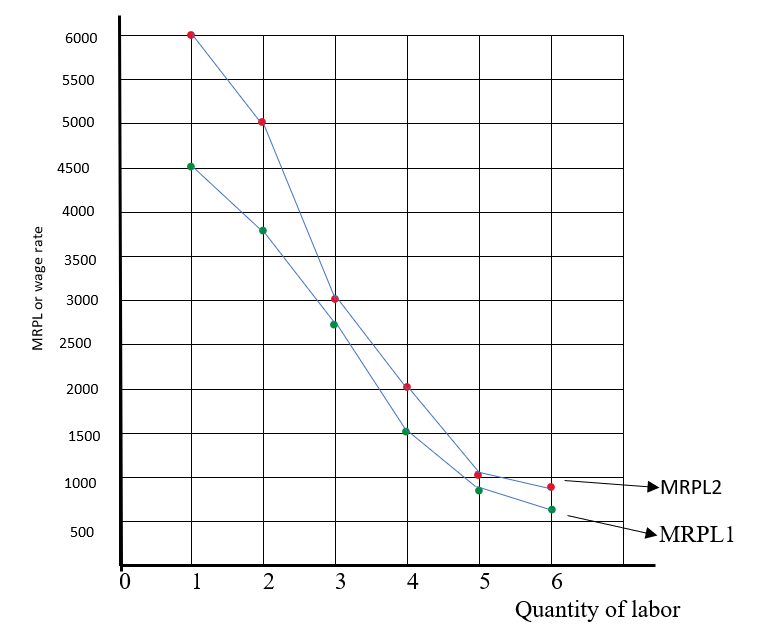
The demand curve for labor if the price of umbrellas increases to $20.
c)
Explanation of Solution
When the price increase to $20 then, the MRPL would be:
| Q (labor) | Q (umbrella) | Marginal product | MRPL at $20 |
| 0 | 0 | 0 | 0 |
| 1 | 300 | 300 | 6000 |
| 2 | 550 | 250 | 5000 |
| 3 | 700 | 150 | 3000 |
| 4 | 800 | 100 | 2000 |
| 5 | 850 | 50 | 1000 |
| 6 | 890 | 40 | 800 |
From the data in the table, the graph will show the new MRPL curve downward and shift to the right because by increasing the price to $20 with the use of extra units of labor, the change in total output started to decline, which makes the curve slope downward. And, here, the price of output is also constant at $20 by hiring more labor, which causes the demand curve to slope downward.
Therefore, the graphical presentation of data is as follows:
Introduction: A demand curve is a graphical representation that shows how sensitive demand is toward the price of a good or service.
Labor is the human capital or human resource that is the factor of production for any firm.
d)
The total quantity that will be produced with each quantity of labor when technological advance doubles the productivity of workers
d)
Answer to Problem 1FRQ
The total quantity that will be produced with each quantity of labor when technological advance doubles the productivity of workers would be 600, 1100, 1400, 1600, 1700, and 1780.
Explanation of Solution
The table would represent the following data when the quantity is doubled:
| Q (labor) | Q (umbrella) | New quantity which doubles the old |
| 0 | 0 | 0 |
| 1 | 300 | 600 (300×2) |
| 2 | 550 | 1,100 (550×2) |
| 3 | 700 | 1400 (700×2) |
| 4 | 800 | 1600 |
| 5 | 850 | 1700 |
| 6 | 890 | 1780 |
Therefore, by doubling the number of umbrellas, at each quantity of labor, the total quantity will be produced as 600, 1100, 1400, 1600, 1700, and 1780.
Introduction: Total quantity is the output that is obtained by using the units of the factor of production.
Chapter 69 Solutions
Krugman's Economics For The Ap® Course

- Describe the various measures used to assess poverty and economic inequality. Analyze the causes and consequences of poverty and inequality, and discuss potential policies and programs aimed at reducing them, assess the adequacy of current environmental regulations in addressing negative externalities. analyze the role of labor unions in labor markets. What is one benefit, and one challenge associated with labor unions.arrow_forwardEvaluate the effectiveness of supply and demand models in predicting labor market outcomes. Justify your assessment with specific examples from real-world labor markets.arrow_forwardExplain the difference between Microeconomics and Macroeconomics? 2.) Explain what fiscal policy is and then explain what Monetary Policy is? 3.) Why is opportunity cost and give one example from your own of opportunity cost. 4.) What are models and what model did we already discuss in class? 5.) What is meant by scarcity of resources?arrow_forward
- 2. What is the payoff from a long futures position where you are obligated to buy at the contract price? What is the payoff from a short futures position where you are obligated to sell at the contract price?? Draw the payoff diagram for each position. Payoff from Futures Contract F=$50.85 S1 Long $100 $95 $90 $85 $80 $75 $70 $65 $60 $55 $50.85 $50 $45 $40 $35 $30 $25 Shortarrow_forward3. Consider a call on the same underlier (Cisco). The strike is $50.85, which is the forward price. The owner of the call has the choice or option to buy at the strike. They get to see the market price S1 before they decide. We assume they are rational. What is the payoff from owning (also known as being long) the call? What is the payoff from selling (also known as being short) the call? Payoff from Call with Strike of k=$50.85 S1 Long $100 $95 $90 $85 $80 $75 $70 $65 $60 $55 $50.85 $50 $45 $40 $35 $30 $25 Shortarrow_forward4. Consider a put on the same underlier (Cisco). The strike is $50.85, which is the forward price. The owner of the call has the choice or option to buy at the strike. They get to see the market price S1 before they decide. We assume they are rational. What is the payoff from owning (also known as being long) the put? What is the payoff from selling (also known as being short) the put? Payoff from Put with Strike of k=$50.85 S1 Long $100 $95 $90 $85 $80 $75 $70 $65 $60 $55 $50.85 $50 $45 $40 $35 $30 $25 Shortarrow_forward
- The following table provides information on two technology companies, IBM and Cisco. Use the data to answer the following questions. Company IBM Cisco Systems Stock Price Dividend (trailing 12 months) $150.00 $50.00 $7.00 Dividend (next 12 months) $7.35 Dividend Growth 5.0% $2.00 $2.15 7.5% 1. You buy a futures contract instead of purchasing Cisco stock at $50. What is the one-year futures price, assuming the risk-free interest rate is 6%? Remember to adjust the futures price for the dividend of $2.15.arrow_forward5. Consider a one-year European-style call option on Cisco stock. The strike is $50.85, which is the forward price. The risk-free interest rate is 6%. Assume the stock price either doubles or halves each period. The price movement corresponds to u = 2 and d = ½ = 1/u. S1 = $100 Call payoff= SO = $50 S1 = $25 Call payoff= What is the call payoff for $1 = $100? What is the call payoff for S1 = $25?arrow_forwardMC The diagram shows a pharmaceutical firm's demand curve and marginal cost curve for a new heart medication for which the firm holds a 20-year patent on its production. Assume this pharmaceutical firm charges a single price for its drug. At its profit-maximizing level of output, it will generate a total profit represented by OA. areas J+K. B. areas F+I+H+G+J+K OC. areas E+F+I+H+G. D. - it is not possible to determine with the informatio OE. the sum of areas A through K. (...) Po P1 Price F P2 E H 0 G B Q MR D ōarrow_forward
- Price Quantity $26 0 The marketing department of $24 20,000 Johnny Rockabilly's record company $22 40,000 has determined that the demand for his $20 60,000 latest CD is given in the table at right. $18 80,000 $16 100,000 $14 120,000 The record company's costs consist of a $240,000 fixed cost of recording the CD, an $8 per CD variable cost of producing and distributing the CD, plus the cost of paying Johnny for his creative talent. The company is considering two plans for paying Johnny. Plan 1: Johnny receives a zero fixed recording fee and a $4 per CD royalty for each CD that is sold. Plan 2: Johnny receives a $400,000 fixed recording fee and zero royalty per CD sold. Under either plan, the record company will choose the price of Johnny's CD so as to maximize its (the record company's) profit. The record company's profit is the revenues minus costs, where the costs include the costs of production, distribution, and the payment made to Johnny. Johnny's payment will be be under plan 2 as…arrow_forwardWhich of the following is the best example of perfect price discrimination? A. Universities give entry scholarships to poorer students. B. Students pay lower prices at the local theatre. ○ C. A hotel charges for its rooms according to the number of days left before the check-in date. ○ D. People who collect the mail coupons get discounts at the local food store. ○ E. An airline offers a discount to students.arrow_forwardConsider the figure at the right. The profit of the single-price monopolist OA. is shown by area D+H+I+F+A. B. is shown by area A+I+F. OC. is shown by area D + H. ○ D. is zero. ○ E. cannot be calculated or shown with just the information given in the graph. (C) Price ($) B C D H FIG шо E MC ATC A MR D = AR Quantityarrow_forward

 Principles of Economics (12th Edition)EconomicsISBN:9780134078779Author:Karl E. Case, Ray C. Fair, Sharon E. OsterPublisher:PEARSON
 Engineering Economy (17th Edition)EconomicsISBN:9780134870069Author:William G. Sullivan, Elin M. Wicks, C. Patrick KoellingPublisher:PEARSON
 Principles of Economics (MindTap Course List)EconomicsISBN:9781305585126Author:N. Gregory MankiwPublisher:Cengage Learning
 Managerial Economics: A Problem Solving ApproachEconomicsISBN:9781337106665Author:Luke M. Froeb, Brian T. McCann, Michael R. Ward, Mike ShorPublisher:Cengage Learning
 Managerial Economics & Business Strategy (Mcgraw-...EconomicsISBN:9781259290619Author:Michael Baye, Jeff PrincePublisher:McGraw-Hill Education