
Videos
a.
To determine the graph of system inequality.
a.
Explanation of Solution
Given:
To draw the graph of
The representation will be,
Graph:
Thus, this is the graphical representation of
Interpretation:
Therefore, this is the graph of system inequality
b.
To determine the shape of the solution region.
b.
Answer to Problem 32PPE
Explanation of Solution
Given:
From the graphical representation of
The representation from the previous section is,
Graph:

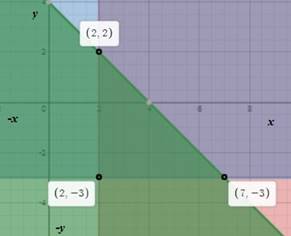
And the shape formed by the overlapping shaded region is triangle.
Interpretation:
Therefore, the shape of the solution region is triangle.
c.
To determine the vertices of the solution region.
c.
Answer to Problem 32PPE
Explanation of Solution
Given:
From the graphical representation of
The representation from the previous section is,
Graph:

The vertices of the triangle are the point where the three solution region interact or intersect it other or overlap each other.
The vertices are
Interpretation:
Therefore, the vertices of the solution region is
d.
To determine the area of the solution region.
d.
Answer to Problem 32PPE
Explanation of Solution
Given:
Formula used:
Area of triangle
Calculation:
From the graphical representation of
The representation from the previous section is,
Graph:

Putting values of base and height
Interpretation:
Therefore, the area of the solution region is
Chapter 6 Solutions
High School Math 2015 Common Core Algebra 1 Student Edition Grade 8/9
Additional Math Textbook Solutions
Elementary Statistics: Picturing the World (7th Edition)
Calculus for Business, Economics, Life Sciences, and Social Sciences (14th Edition)
A First Course in Probability (10th Edition)
Using and Understanding Mathematics: A Quantitative Reasoning Approach (6th Edition)
Introductory Statistics
Algebra and Trigonometry (6th Edition)


- 3. A scientist recorded the movement of a pendulum for 10 s. The scientist began recording when the pendulum was at its resting position. The pendulum then moved right (positive displacement) and left (negative displacement) several times. The pendulum took 4 s to swing to the right and the left and then return to its resting position. The pendulum's furthest distance to either side was 6 in. Graph the function that represents the pendulum's displacement as a function of time. Answer: f(t) (a) Write an equation to represent the displacement of the pendulum as a function of time. (b) Graph the function. 10 9 8 7 6 5 4 3 2 1 0 t 1 2 3 4 5 6 7 8 9 10 11 12 13 14 15 -1 -5. -6 -7 -8 -9 -10-arrow_forwardA power outage occurs 6 min after the ride started. Passengers must wait for their cage to be manually cranked into the lowest position in order to exit the ride. Sine function model: h = −82.5 cos (3πt) + 97.5 where h is the height of the last passenger above the ground measured in feet and t is the time of operation of the ride in minutes. (a) What is the height of the last passenger at the moment of the power outage? Verify your answer by evaluating the sine function model. (b) Will the last passenger to board the ride need to wait in order to exit the ride? Explain.arrow_forwardThe Colossus Ferris wheel debuted at the 1984 New Orleans World's Fair. The ride is 180 ft tall, and passengers board the ride at an initial height of 15 ft above the ground. The height above ground, h, of a passenger on the ride is a periodic function of time, t. The graph displays the height above ground of the last passenger to board over the course of the 15 min ride. Height of Passenger in Ferris Wheel 180 160 140- €120 Height, h (ft) 100 80 60 40 20 0 ך 1 2 3 4 5 6 7 8 9 10 11 12 13 14 15 Time of operation, t (min) Sine function model: h = −82.5 cos (3πt) + 97.5 where h is the height of the passenger above the ground measured in feet and t is the time of operation of the ride in minutes. What is the period of the sine function model? Interpret the period you found in the context of the operation of the Ferris wheel. Answer:arrow_forward
- 1. Graph the function f(x)=sin(x) −2¸ Answer: y -2π 一元 1 −1 -2 -3 -4+ 元 2πarrow_forward3. Graph the function f(x) = −(x-2)²+4 Answer: f(x) 6 5 4 3 2+ 1 -6-5 -4-3-2-1 × 1 2 3 4 5 6 -1 -2+ ရာ -3+ -4+ -5 -6arrow_forward2. Graph the function f(x) = cos(2x)+1 Answer: -2π 一元 y 3 2- 1 -1 -2+ ရာ -3- Π 2πarrow_forward
- 2. Graph the function f(x) = |x+1+2 Answer: -6-5-4-3-2-1 f(x) 6 5 4 3 2 1 1 2 3 4 5 6 -1 -2 -3 -4 -5 -6arrow_forward1. The table shows values of a function f(x). What is the average rate of change of f(x) over the interval from x = 5 to x = 9? Show your work. X 4 f(x) LO 5 6 7 8 9 10 -2 8 10 11 14 18arrow_forward• Find a real-world situation that can be represented by a sinusoidal function. You may find something online that represents a sinusoidal graph or you can create a sinusoidal graph yourself with a measuring tape and a rope. • Provide a graph complete with labels and units for the x- and y-axes. • Describe the amplitude, period, and vertical shift in terms of the real-world situation.arrow_forward
- f(x) = 4x²+6x 2. Given g(x) = 2x² +13x+15 and find 41 (4)(x) Show your work.arrow_forwardf(x) = x² − 6x + 8 3. Given and g(x) = x -2 solve f(x) = g(x) using a table of values. Show your work.arrow_forward1. Graph the function f(x) = 3√x-2 Answer: -6-5 -4-3-2 -1 6 LO 5 f(x) 4 3 2+ 1 1 2 3 4 5 6 -1 -2+ -3 -4 -5 -6- 56arrow_forward
 Algebra and Trigonometry (6th Edition)AlgebraISBN:9780134463216Author:Robert F. BlitzerPublisher:PEARSON
 Contemporary Abstract AlgebraAlgebraISBN:9781305657960Author:Joseph GallianPublisher:Cengage Learning
 Linear Algebra: A Modern IntroductionAlgebraISBN:9781285463247Author:David PoolePublisher:Cengage Learning
 Algebra And Trigonometry (11th Edition)AlgebraISBN:9780135163078Author:Michael SullivanPublisher:PEARSON
 Introduction to Linear Algebra, Fifth EditionAlgebraISBN:9780980232776Author:Gilbert StrangPublisher:Wellesley-Cambridge Press
 College Algebra (Collegiate Math)AlgebraISBN:9780077836344Author:Julie Miller, Donna GerkenPublisher:McGraw-Hill Education