
Concept explainers
Videos
Applying the Concepts 6–3
Times To Travel to School
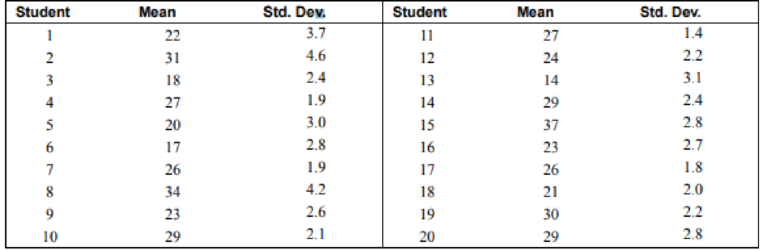
Twenty students from a statistics class each collected a random sample of times on how long it took students to get to class from their homes. All the sample sizes were 30. The resulting means are listed.
1. The students noticed that everyone had different answers. If you randomly sample over and over from any population, with the same
2. The students wondered whose results were right. How can they find out what the population
3. Input the means into the computer and check if the distribution is normal.
4. Check the mean and standard deviation of the means. How do these values compare to the students’ individual scores?
5. Is the distribution of the means a sampling distribution?
6. Check the sampling error for students 3, 7, and 14.
7. Compare the standard deviation of the sample of the 20 means. Is that equal to the standard deviation from student 3 divided by the square of the sample size? How about for student 7, or 14?
See page 368 for the answers.
1.
To check: Whether the result will be same when a random sample with same sample size is selected over and over from any population results in same mean.
Answer to Problem 1AC
No, the result will be same when a random sample with same sample size is selected over and over from any population results in same mean.
Explanation of Solution
Given info:
Twenty students each collected a random sample of times on how long it took students to get to class from their homes. Sample size is 30.
Justification:
Since, population is very large, and it’s very rare that the observations in each sample are same or close to each other. Also, it’s very rare event that samples from such a large population have same means. Therefore, the probability that different samples of same size have same means is approximately zero since that event is very rare. Thus, a random sample over and over from any population does not results in same mean.
2.
The method to find population mean and population standard deviation.
Answer to Problem 1AC
By taking average of all sample means and standard deviations.
Explanation of Solution
Given info:
Sample means and sample standard deviations of 20 samples.
Justification:
Since, sample means and sample standard deviations are given; therefore population mean can be estimated by taking average of all sample means.
Similarly, population standard deviation can be estimated by taking average of all given standard deviations.
3.
Whether the distribution is normal or not.
Answer to Problem 1AC
Given data is not normal.
Explanation of Solution
Given info:
Means of 30 samples are given.
Table:
| Students | Average time |
| 1 | 22 |
| 2 | 31 |
| 3 | 18 |
| 4 | 27 |
| 5 | 20 |
| 6 | 17 |
| 7 | 26 |
| 8 | 34 |
| 9 | 23 |
| 10 | 29 |
| 11 | 27 |
| 12 | 24 |
| 13 | 14 |
| 14 | 29 |
| 15 | 37 |
| 16 | 23 |
| 17 | 26 |
| 18 | 21 |
| 19 | 30 |
| 20 | 29 |
Software procedure:
Step-by-step procedure to obtain the histogram using the MINITAB software:
- Enter the given data in columns.
- Choose Graph > select Histogram > select with fit > select ok.
- Select the column of average time.
- Click OK.
Output using the MINITAB software is given below:

From MINITAB output, the data of 20 means is not normal but is highly negatively skewed.
4.
To find the mean and standard deviation of the sample means.
Answer to Problem 1AC
Mean and standard deviation of sample means is 25.4 and 5.8 resp.
Explanation of Solution
Given info:
Sample means and sample standard deviations of 20 samples of size 30 each are given in table.
Table:
| Students | Average time | Standard deviation |
| 1 | 22 | 3.7 |
| 2 | 31 | 4.6 |
| 3 | 18 | 2.4 |
| 4 | 27 | 1.9 |
| 5 | 20 | 3 |
| 6 | 17 | 2.8 |
| 7 | 26 | 1.9 |
| 8 | 34 | 4.2 |
| 9 | 23 | 2.6 |
| 10 | 29 | 2.1 |
| 11 | 27 | 1.4 |
| 12 | 24 | 2.2 |
| 13 | 14 | 3.1 |
| 14 | 29 | 2.4 |
| 15 | 37 | 2.8 |
| 16 | 23 | 2.7 |
| 17 | 26 | 1.8 |
| 18 | 21 | 2 |
| 19 | 30 | 2.2 |
| 20 | 29 | 2.8 |
Software procedure:
Step-by-step procedure to obtain the probability using the MINITAB software:
- Choose Stat > Basic Statistics > Display Descriptive Statistics.
- In Variables enter the columns Average time and StDev.
- Click OK.
Statistics

5.
Whether distribution of means is sampling distribution.
Answer to Problem 1AC
No.
Explanation of Solution
Given info:
Sample means and sample standard deviations of 20 samples of size 30 each.
Justification:
In given question each sample size is 30. Sampling distribution means that distribution of all possible samples of size 30 from the population. But, there are only 20 samples which are very less. Therefore, distribution of given sample means is not a sampling distribution.
6.
the standard error for 3rd, 7th and 14th students.
Answer to Problem 1AC
Standard errors of 3rd, 7th and 14th students are −7.4, 0.6 and 3.6 respectively.
Explanation of Solution
Given info:
Sample means for 3rd, 7th and 14th students are 18, 26, 29 respectively.
From part 4, mean of sample means is 25.4.
Calculation:
Let,
S represents mean of sample means.
S3 represents mean corresponding to 3rd student.
S7 represents mean corresponding to 7th student.
S14 represents mean corresponding to14th student.
Similarly,
The standard errors of 3rd, 7th and 14th students are −7.4, 0.6 and 3.6 respectively.
7.
Compare the standard deviation for 3rd, 7th and 14th students divided by sample size 30 with standard deviations of means.
Answer to Problem 1AC
Standard deviation of means is greater than standard deviation divided by square root of the sample size.
Explanation of Solution
Given Info:
Sample deviations for 3rd, 7th and 14th students.
From part 4, standard deviation of sample means is 5.8.
Sample size is 30.
Calculation:
SD represents the standard deviation of sample means.
SD3 represents the value obtained by dividing standard deviation of 3rd student divided by sample size.
SD7 represents the value obtained by dividing standard deviation of 7th student divided by sample size.
SD14 represents the value obtained by dividing standard deviation of 14th student divided by sample size.
So, SD3 is less than SD
So, SD7 is less than SD.
So, SD14 is less than SD.
Therefore, the standard deviations for 3rd, 7th and 14th student divided by sample sizes are less than the standard deviation of means.
Moreover, the standard deviation of means is greater than standard deviation divided by square root of the sample size.
Want to see more full solutions like this?
Chapter 6 Solutions
ALEKS 360 ELEM STATISTICS


- A smallish urn contains 25 small plastic bunnies - 7 of which are pink and 18 of which are white. 10 bunnies are drawn from the urn at random with replacement, and X is the number of pink bunnies that are drawn. (a) P(X = 5)=[Select] (b) P(X<6) [Select]arrow_forwardElementary StatisticsBase on the same given data uploaded in module 4, will you conclude that the number of bathroom of houses is a significant factor for house sellprice? I your answer is affirmative, you need to explain how the number of bathroom influences the house price, using a post hoc procedure. (Please treat number of bathrooms as a categorical variable in this analysis)Base on the same given data, conduct an analysis for the variable sellprice to see if sale price is influenced by living area. Summarize your finding including all regular steps (learned in this module) for your method. Also, will you conclude that larger house corresponding to higher price (justify)?Each question need to include a spss or sas output. Instructions: You have to use SAS or SPSS to perform appropriate procedure: ANOVA or Regression based on the project data (provided in the module 4) and research question in the project file. Attach the computer output of all key steps (number) quoted in…arrow_forwardElementary StatsBase on the given data uploaded in module 4, change the variable sale price into two categories: abovethe mean price or not; and change the living area into two categories: above the median living area ornot ( your two group should have close number of houses in each group). Using the resulting variables,will you conclude that larger house corresponding to higher price?Note: Need computer output, Ho and Ha, P and decision. If p is small, you need to explain what type ofdependency (association) we have using an appropriate pair of percentages. Please include how to use the data in SPSS and interpretation of data.arrow_forward
- An environmental research team is studying the daily rainfall (in millimeters) in a region over 100 days. The data is grouped into the following histogram bins: Rainfall Range (mm) Frequency 0-9.9 15 10 19.9 25 20-29.9 30 30-39.9 20 ||40-49.9 10 a) If a random day is selected, what is the probability that the rainfall was at least 20 mm but less than 40 mm? b) Estimate the mean daily rainfall, assuming the rainfall in each bin is uniformly distributed and the midpoint of each bin represents the average rainfall for that range. c) Construct the cumulative frequency distribution and determine the rainfall level below which 75% of the days fall. d) Calculate the estimated variance and standard deviation of the daily rainfall based on the histogram data.arrow_forwardAn electronics company manufactures batches of n circuit boards. Before a batch is approved for shipment, m boards are randomly selected from the batch and tested. The batch is rejected if more than d boards in the sample are found to be faulty. a) A batch actually contains six faulty circuit boards. Find the probability that the batch is rejected when n = 20, m = 5, and d = 1. b) A batch actually contains nine faulty circuit boards. Find the probability that the batch is rejected when n = 30, m = 10, and d = 1.arrow_forwardTwenty-eight applicants interested in working for the Food Stamp program took an examination designed to measure their aptitude for social work. A stem-and-leaf plot of the 28 scores appears below, where the first column is the count per branch, the second column is the stem value, and the remaining digits are the leaves. a) List all the values. Count 1 Stems Leaves 4 6 1 4 6 567 9 3688 026799 9 8 145667788 7 9 1234788 b) Calculate the first quartile (Q1) and the third Quartile (Q3). c) Calculate the interquartile range. d) Construct a boxplot for this data.arrow_forward
- Pam, Rob and Sam get a cake that is one-third chocolate, one-third vanilla, and one-third strawberry as shown below. They wish to fairly divide the cake using the lone chooser method. Pam likes strawberry twice as much as chocolate or vanilla. Rob only likes chocolate. Sam, the chooser, likes vanilla and strawberry twice as much as chocolate. In the first division, Pam cuts the strawberry piece off and lets Rob choose his favorite piece. Based on that, Rob chooses the chocolate and vanilla parts. Note: All cuts made to the cake shown below are vertical.Which is a second division that Rob would make of his share of the cake?arrow_forwardThree players (one divider and two choosers) are going to divide a cake fairly using the lone divider method. The divider cuts the cake into three slices (s1, s2, and s3). If the choosers' declarations are Chooser 1: {s1 , s2} and Chooser 2: {s2 , s3}. Using the lone-divider method, how many different fair divisions of this cake are possible?arrow_forwardTheorem 2.6 (The Minkowski inequality) Let p≥1. Suppose that X and Y are random variables, such that E|X|P <∞ and E|Y P <00. Then X+YpX+Yparrow_forward
- Theorem 1.2 (1) Suppose that P(|X|≤b) = 1 for some b > 0, that EX = 0, and set Var X = 0². Then, for 0 0, P(X > x) ≤e-x+1²² P(|X|>x) ≤2e-1x+1²² (ii) Let X1, X2...., Xn be independent random variables with mean 0, suppose that P(X ≤b) = 1 for all k, and set oσ = Var X. Then, for x > 0. and 0x) ≤2 exp Σ k=1 (iii) If, in addition, X1, X2, X, are identically distributed, then P(S|x) ≤2 expl-tx+nt²o).arrow_forwardTheorem 5.1 (Jensen's inequality) state without proof the Jensen's Ineg. Let X be a random variable, g a convex function, and suppose that X and g(X) are integrable. Then g(EX) < Eg(X).arrow_forwardCan social media mistakes hurt your chances of finding a job? According to a survey of 1,000 hiring managers across many different industries, 76% claim that they use social media sites to research prospective candidates for any job. Calculate the probabilities of the following events. (Round your answers to three decimal places.) answer parts a-c. a) Out of 30 job listings, at least 19 will conduct social media screening. b) Out of 30 job listings, fewer than 17 will conduct social media screening. c) Out of 30 job listings, exactly between 19 and 22 (including 19 and 22) will conduct social media screening. show all steps for probabilities please. answer parts a-c.arrow_forward
 Holt Mcdougal Larson Pre-algebra: Student Edition...AlgebraISBN:9780547587776Author:HOLT MCDOUGALPublisher:HOLT MCDOUGAL
 Glencoe Algebra 1, Student Edition, 9780079039897...AlgebraISBN:9780079039897Author:CarterPublisher:McGraw Hill
 College Algebra (MindTap Course List)AlgebraISBN:9781305652231Author:R. David Gustafson, Jeff HughesPublisher:Cengage Learning
 Algebra and Trigonometry (MindTap Course List)AlgebraISBN:9781305071742Author:James Stewart, Lothar Redlin, Saleem WatsonPublisher:Cengage Learning