
Videos
Sports: Surfing In Hawaii, January is a favorite month for surfing since 60% of the days have a surf of at least 6 feet (Reference: Hawaii Data Book, Robert C. Schmitt). You work day shifts in a Honolulu hospital emergency room. At the beginning of each month you select your days off, and you pick 7 days at random in January to go surfing. Let r be the number of days the surf is at least 6 feet.
(a) Make a histogram of the
(b) What is the probability of getting 5 or more days when the surf is at least 6 feet?
(c) What is the probability of getting fewer than 3 days when the surf is at least 6 feet?
(d) What is the expected number of days when the surf will be at least 6 feet?
(e) What is the standard deviation of the r-probability distribution?
(d) Interpretation Can you be fairly confident that the surf will be at least 6 feet high on one of your days off? Explain.
(a)
To graph: The histogram.
Explanation of Solution
Given: 60% of the days in January have a surf height of at least 6 feet and the number of days randomly picked in January is 7.
Graph:
According to the provided details, the number of days the surf is at least 6 feet high, r follows the binomial distribution with the probability of success in a single trial (p) is 0.60 and the number of trials (n) are 7.
Consider, the probability values provided in Table 2 of the appendix for
The probability values for
Follow the steps given below to obtain the histogram:
Step 1: Place the values of r- 0, 1, 2, 3, 4, 5, 6, and 7 on the horizontal axis.
Step 2: Place the values of
Step 3: Construct a bar over each of the r values (0, 1, 2, 3, 4, 5, 6, 7) ranging from
The histogram for the binomial distribution for
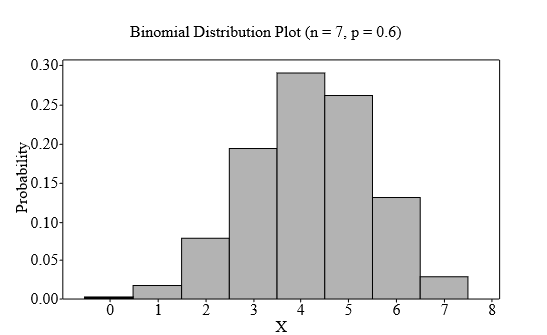
Interpretation: The graph above displays the fact that the binomial distribution having
(b)
To find: The probability of getting 5 or more days when the surf is at least 6 feet high.
Answer to Problem 11P
Solution: The probability is 0.420.
Explanation of Solution
Given: The provided values are:
Calculation: The random variable ‘r’ follows the binomial distribution with the parameters,
The probability of getting 5 or more days when the surf is at least 6 feet high can be calculated by:
Consider, the probability values provided in the Table 2 of the appendix for
The probability values for
Substitute the values in the above formula,
The required probability is 0.420.
Interpretation: There is a 42% chance of getting 5 or more days when the surf is at least 6 feet high.
(c)
To find: The probability of getting fewer than 3 days when the surf is at least 6 feet high.
Answer to Problem 11P
Solution: The probability is 0.096.
Explanation of Solution
Given: The provided values are:
Calculation: The random variable ‘r’ follows the binomial distribution with the parameters
The probability of getting fewer than 3 days when the surf is at least 6 feet high can be calculated by:
Consider, the probability values provided in the Table 2 of the appendix for
The probability values for
Substitute the values in the above formula. Thus,
The required probability is 0.096.
Interpretation: There is a 9.6% chance of getting fewer than 3 days when the surf is at least 6 feet high.
(d)
To find: The expected number of days when the surf will be at least 6 feet high.
Answer to Problem 11P
Solution: The expected value is 4.2.
Explanation of Solution
Given: The provided values are:
Calculation: The random variable ‘r’ follows the binomial distribution with the parameters,
The formula that is used to calculate the expected value of the binomial distribution is:
Substitute the provided values in the above formula,
The expected value is 4.2.
Interpretation: One can expect 4.2 out of 7 days when the surf will be at least 6 feet high.
(e)
To find: The standard deviation of the r-distribution.
Answer to Problem 11P
Solution: The standard deviation is 1.296.
Explanation of Solution
Given: The provided values are:
Calculation: The random variable ‘r’ follows the binomial distribution with the parameters,
The formula that is used to calculate the standard deviation of the binomial distribution is:
Substitute the provided values in the above formula,
The standard deviation is 1.296.
Interpretation: The standard deviation of the probability distribution of r is 1.296.
(f)
To explain: Whether one can be fairly confident that the surf will be at least 6 feet high on one of your days off.
Answer to Problem 11P
Solution: Yes, one can be fairly confident as the expected number of days the surf will be at least 6 feet high is 4. The probability of getting at least 1 day out of 7 during which the surf will be at least 6 feet high is 0.998.
Explanation of Solution
Given: The provided values are:
Calculation: The random variable ‘r’ follows the binomial distribution with the parameters,
The probability of getting at least 1 day out of 7 during which the surf will be at least 6 feet high can be calculated by:
Consider, the probability values provided in Table 2 of the appendix for
The probability value for
Substitute the values in the above formula. Thus,
The probability is 0.998.
Interpretation: The expected number of days that the surf will be at least 6 feet high is approximately 4 and there is a 99.8% chance of getting a surf that is at least 6 feet high on one of the days off out of 7 days. So, one can be confident of getting it.
Want to see more full solutions like this?
Chapter 6 Solutions
Bundle: Understanding Basic Statistics, Loose-leaf Version, 8th + WebAssign Printed Access Card, Single-Term


- how could the bar graph have been organized differently to make it easier to compare opinion changes within political partiesarrow_forwardDraw a picture of a normal distribution with mean 70 and standard deviation 5.arrow_forwardWhat do you guess are the standard deviations of the two distributions in the previous example problem?arrow_forward
- Please answer the questionsarrow_forward30. An individual who has automobile insurance from a certain company is randomly selected. Let Y be the num- ber of moving violations for which the individual was cited during the last 3 years. The pmf of Y isy | 1 2 4 8 16p(y) | .05 .10 .35 .40 .10 a.Compute E(Y).b. Suppose an individual with Y violations incurs a surcharge of $100Y^2. Calculate the expected amount of the surcharge.arrow_forward24. An insurance company offers its policyholders a num- ber of different premium payment options. For a ran- domly selected policyholder, let X = the number of months between successive payments. The cdf of X is as follows: F(x)=0.00 : x < 10.30 : 1≤x<30.40 : 3≤ x < 40.45 : 4≤ x <60.60 : 6≤ x < 121.00 : 12≤ x a. What is the pmf of X?b. Using just the cdf, compute P(3≤ X ≤6) and P(4≤ X).arrow_forward
- 59. At a certain gas station, 40% of the customers use regular gas (A1), 35% use plus gas (A2), and 25% use premium (A3). Of those customers using regular gas, only 30% fill their tanks (event B). Of those customers using plus, 60% fill their tanks, whereas of those using premium, 50% fill their tanks.a. What is the probability that the next customer will request plus gas and fill the tank (A2 B)?b. What is the probability that the next customer fills the tank?c. If the next customer fills the tank, what is the probability that regular gas is requested? Plus? Premium?arrow_forward38. Possible values of X, the number of components in a system submitted for repair that must be replaced, are 1, 2, 3, and 4 with corresponding probabilities .15, .35, .35, and .15, respectively. a. Calculate E(X) and then E(5 - X).b. Would the repair facility be better off charging a flat fee of $75 or else the amount $[150/(5 - X)]? [Note: It is not generally true that E(c/Y) = c/E(Y).]arrow_forward74. The proportions of blood phenotypes in the U.S. popula- tion are as follows:A B AB O .40 .11 .04 .45 Assuming that the phenotypes of two randomly selected individuals are independent of one another, what is the probability that both phenotypes are O? What is the probability that the phenotypes of two randomly selected individuals match?arrow_forward
- 53. A certain shop repairs both audio and video compo- nents. Let A denote the event that the next component brought in for repair is an audio component, and let B be the event that the next component is a compact disc player (so the event B is contained in A). Suppose that P(A) = .6 and P(B) = .05. What is P(BA)?arrow_forward26. A certain system can experience three different types of defects. Let A;(i = 1,2,3) denote the event that the sys- tem has a defect of type i. Suppose thatP(A1) = .12 P(A) = .07 P(A) = .05P(A, U A2) = .13P(A, U A3) = .14P(A2 U A3) = .10P(A, A2 A3) = .011Rshelfa. What is the probability that the system does not havea type 1 defect?b. What is the probability that the system has both type 1 and type 2 defects?c. What is the probability that the system has both type 1 and type 2 defects but not a type 3 defect? d. What is the probability that the system has at most two of these defects?arrow_forwardThe following are suggested designs for group sequential studies. Using PROCSEQDESIGN, provide the following for the design O’Brien Fleming and Pocock.• The critical boundary values for each analysis of the data• The expected sample sizes at each interim analysisAssume the standardized Z score method for calculating boundaries.Investigators are evaluating the success rate of a novel drug for treating a certain type ofbacterial wound infection. Since no existing treatment exists, they have planned a one-armstudy. They wish to test whether the success rate of the drug is better than 50%, whichthey have defined as the null success rate. Preliminary testing has estimated the successrate of the drug at 55%. The investigators are eager to get the drug into production andwould like to plan for 9 interim analyses (10 analyzes in total) of the data. Assume thesignificance level is 5% and power is 90%.Besides, draw a combined boundary plot (OBF, POC, and HP)arrow_forward
 Glencoe Algebra 1, Student Edition, 9780079039897...AlgebraISBN:9780079039897Author:CarterPublisher:McGraw Hill
 Holt Mcdougal Larson Pre-algebra: Student Edition...AlgebraISBN:9780547587776Author:HOLT MCDOUGALPublisher:HOLT MCDOUGAL
 Algebra: Structure And Method, Book 1AlgebraISBN:9780395977224Author:Richard G. Brown, Mary P. Dolciani, Robert H. Sorgenfrey, William L. ColePublisher:McDougal Littell
 Big Ideas Math A Bridge To Success Algebra 1: Stu...AlgebraISBN:9781680331141Author:HOUGHTON MIFFLIN HARCOURTPublisher:Houghton Mifflin Harcourt
 College Algebra (MindTap Course List)AlgebraISBN:9781305652231Author:R. David Gustafson, Jeff HughesPublisher:Cengage Learning