
Elementary Statistics (13th Edition)
13th Edition
ISBN: 9780134462455
Author: Mario F. Triola
Publisher: PEARSON
expand_more
expand_more
format_list_bulleted
Concept explainers
Videos
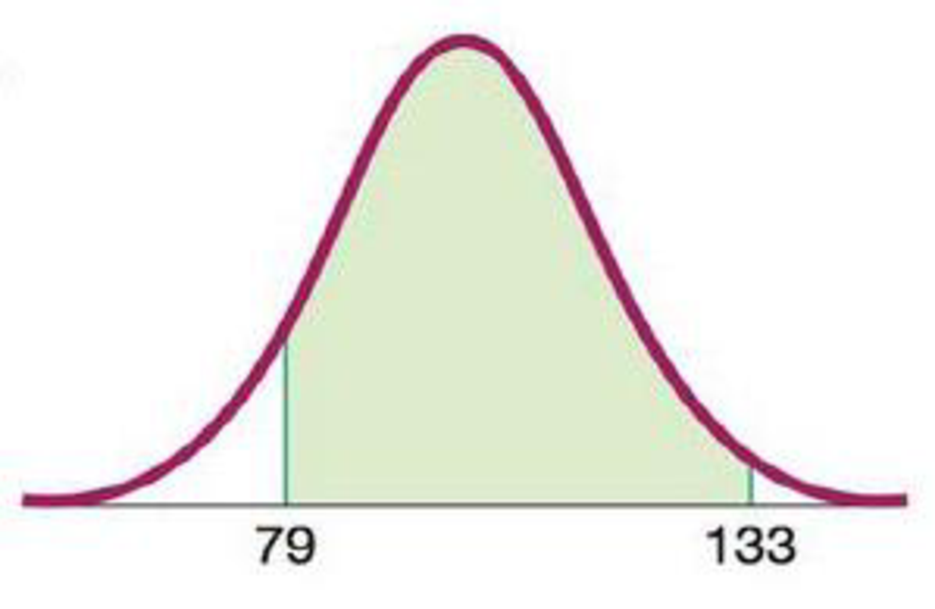
Textbook Question
Chapter 6.2, Problem 7BSC
IQ Scores. In Exercises 5–8, find the area of the shaded region. The graphs depict IQ scores of adults, and those scores are
7.
Expert Solution & Answer

Learn your wayIncludes step-by-step video

schedule03:03
Students have asked these similar questions
Joy is making Christmas gifts. She has 6 1/12 feet of yarn and will need 4 1/4 to complete our project. How much yarn will she have left over compute this solution in two different ways 
Solve for X. Explain each step.
2^2x • 2^-4=8
One hundred people were surveyed, and one question pertained to their educational background. The results of this question and their genders are given in the following table.
Female (F)
Male (F′)
Total
College degree (D)
30
20
50
No college degree (D′)
30
20
50
Total
60
40
100
If a person is selected at random from those surveyed, find the probability of each of the following events.1. The person is female or has a college degree. Answer:
equation editor
Equation Editor
2. The person is male or does not have a college degree. Answer:
equation editor
Equation Editor
3. The person is female or does not have a college degree.
Chapter 6 Solutions
Elementary Statistics (13th Edition)
Ch. 6.1 - Normal Distribution Whats wrong with the following...Ch. 6.1 - Normal Distribution A normal distribution is...Ch. 6.1 - Standard Normal Distribution Identify the two...Ch. 6.1 - Notation What does the notation z indicate?Ch. 6.1 - Continuous Uniform Distribution. In Exercises 58,...Ch. 6.1 - Continuous Uniform Distribution. In Exercises 58,...Ch. 6.1 - Continuous Uniform Distribution. In Exercises 58,...Ch. 6.1 - Continuous Uniform Distribution. In Exercises 58,...Ch. 6.1 - Standard Normal Distribution. In Exercises 912,...Ch. 6.1 - Standard Normal Distribution. In Exercises 912,...
Ch. 6.1 - Standard Normal Distribution. In Exercises 912,...Ch. 6.1 - Standard Normal Distribution. In Exercises 912,...Ch. 6.1 - Standard Normal Distribution. In Exercises 1316,...Ch. 6.1 - Standard Normal Distribution. In Exercises 1316,...Ch. 6.1 - Standard Normal Distribution. In Exercises 1316,...Ch. 6.1 - Standard Normal Distribution. In Exercises 1316,...Ch. 6.1 - Standard Normal Distribution. In Exercises 1736,...Ch. 6.1 - Standard Normal Distribution. In Exercises 1736,...Ch. 6.1 - Standard Normal Distribution. In Exercises 1736,...Ch. 6.1 - Standard Normal Distribution. In Exercises 1736,...Ch. 6.1 - Standard Normal Distribution. In Exercises 1736,...Ch. 6.1 - Standard Normal Distribution. In Exercises 1736,...Ch. 6.1 - Standard Normal Distribution. In Exercises 1736,...Ch. 6.1 - Standard Normal Distribution. In Exercises 1736,...Ch. 6.1 - Standard Normal Distribution. In Exercises 1736,...Ch. 6.1 - Standard Normal Distribution. In Exercises 1736,...Ch. 6.1 - Standard Normal Distribution. In Exercises 1736,...Ch. 6.1 - Standard Normal Distribution. In Exercises 1736,...Ch. 6.1 - Standard Normal Distribution. In Exercises 1736,...Ch. 6.1 - Standard Normal Distribution. In Exercises 1736,...Ch. 6.1 - Standard Normal Distribution. In Exercises 1736,...Ch. 6.1 - Standard Normal Distribution. In Exercises 1736,...Ch. 6.1 - Standard Normal Distribution. In Exercises 1736,...Ch. 6.1 - Standard Normal Distribution. In Exercises 1736,...Ch. 6.1 - Standard Normal Distribution. In Exercises 1736,...Ch. 6.1 - Standard Normal Distribution. In Exercises 1736,...Ch. 6.1 - Finding Bone Density Scores. In Exercises 3740...Ch. 6.1 - Finding Bone Density Scores. In Exercises 3740...Ch. 6.1 - Finding Bone Density Scores. In Exercises 3740...Ch. 6.1 - Finding Bone Density Scores. In Exercises 3740...Ch. 6.1 - Critical Values. In Exercises 4144, find the...Ch. 6.1 - Critical Values. In Exercises 4144, find the...Ch. 6.1 - Critical Values. In Exercises 4144, find the...Ch. 6.1 - Critical Values. In Exercises 4144, find the...Ch. 6.1 - Basis for the Range Rule of Thumb and the...Ch. 6.1 - Basis for the Range Rule of Thumb and the...Ch. 6.1 - Basis for the Range Rule of Thumb and the...Ch. 6.1 - Basis for the Range Rule of Thumb and the...Ch. 6.1 - Significance For bone density scores that are...Ch. 6.1 - Distributions In a continuous uniform...Ch. 6.2 - Birth Weights Based on Data Set 4 Births in...Ch. 6.2 - Birth Weights Based on Data Set 4 Births in...Ch. 6.2 - Normal Distributions What is the difference...Ch. 6.2 - Random Digits Computers are commonly used to...Ch. 6.2 - IQ Scores. In Exercises 58, find the area of the...Ch. 6.2 - IQ Scores. In Exercises 58, find the area of the...Ch. 6.2 - IQ Scores. In Exercises 58, find the area of the...Ch. 6.2 - IQ Scores. In Exercises 58, find the area of the...Ch. 6.2 - IQ Scores. In Exercises 912, find the indicated IQ...Ch. 6.2 - IQ Scores. In Exercises 912, find the indicated IQ...Ch. 6.2 - IQ Scores. In Exercises 912, find the indicated IQ...Ch. 6.2 - IQ Scores. In Exercises 912, find the indicated IQ...Ch. 6.2 - Seat Designs. In Exercises 1320, use the data in...Ch. 6.2 - Seat Designs. In Exercises 1320, use the data in...Ch. 6.2 - Seat Designs. In Exercises 1320, use the data in...Ch. 6.2 - Seat Designs. In Exercises 1320, use the data in...Ch. 6.2 - Seat Designs. In Exercises 1320, use the data in...Ch. 6.2 - Seat Designs. In Exercises 1320, use the data in...Ch. 6.2 - Seat Designs. In Exercises 1320, use the data in...Ch. 6.2 - Seat Designs. In Exercises 1320, use the data in...Ch. 6.2 - In Exercises 2124, use these parameters (based on...Ch. 6.2 - In Exercises 2124, use these parameters (based on...Ch. 6.2 - In Exercises 2124, use these parameters (based on...Ch. 6.2 - In Exercises 2124, use these parameters (based on...Ch. 6.2 - Eye Contact In a study of facial behavior, people...Ch. 6.2 - Designing a Work Station A common design...Ch. 6.2 - Jet Ejection Seats The U.S. Air Force once used...Ch. 6.2 - Quarters After 1964, quarters were manufactured so...Ch. 6.2 - Low Birth Weight The University of Maryland...Ch. 6.2 - Body Temperatures Based on the sample results in...Ch. 6.2 - Durations of Pregnancies The lengths of...Ch. 6.2 - Water Taxi Safety When a water taxi sank in...Ch. 6.2 - Large Data Sets. In Exercises 33 and 34, refer to...Ch. 6.2 - Large Data Sets. In Exercises 33 and 34, refer to...Ch. 6.2 - Curving Test Scores A professor gives a test and...Ch. 6.2 - Outliers For the purposes of constructing modified...Ch. 6.3 - Births There are about 11,000 births each day in...Ch. 6.3 - Sampling with Replacement The Orangetown Medical...Ch. 6.3 - Unbiased Estimators Data Set 4 Births in Appendix...Ch. 6.3 - Sampling Distribution Data Set 4 Births in...Ch. 6.3 - Good Sample? A geneticist is investigating the...Ch. 6.3 - College Presidents There are about 4200 college...Ch. 6.3 - In Exercises 710, use the same population of {4,...Ch. 6.3 - In Exercises 710, use the same population of {4,...Ch. 6.3 - In Exercises 710, use the same population of {4,...Ch. 6.3 - In Exercises 710, use the same population of {4,...Ch. 6.3 - In Exercises 1114, use the population of {34, 36,...Ch. 6.3 - In Exercises 1114, use the population of {34, 36,...Ch. 6.3 - In Exercises 1114, use the population of {34, 36,...Ch. 6.3 - In Exercises 1114, use the population of {34, 36,...Ch. 6.3 - Births: Sampling Distribution of Sample Proportion...Ch. 6.3 - Births: Sampling Distribution of Sample Proportion...Ch. 6.3 - SAT and ACT Tests Because they enable efficient...Ch. 6.3 - Hybridization A hybridization experiment begins...Ch. 6.3 - Using a Formula to Describe a Sampling...Ch. 6.3 - Mean Absolute Deviation Is the mean absolute...Ch. 6.4 - Requirements A researcher collects a simple random...Ch. 6.4 - Small Sample Weights of golden retriever dogs are...Ch. 6.4 - Notation In general, what do the symbols x and x...Ch. 6.4 - Annual Incomes Annual incomes are known to have a...Ch. 6.4 - Using the Central Limit Theorem. In Exercises 58,...Ch. 6.4 - Using the Central Limit Theorem. In Exercises 58,...Ch. 6.4 - Using the Central Limit Theorem. In Exercises 58,...Ch. 6.4 - Using the Central Limit Theorem. In Exercises 58,...Ch. 6.4 - Elevator Safety Example 2 referred to an elevator...Ch. 6.4 - Elevator Safety Exercise 9 uses = 189 lb, which...Ch. 6.4 - Mensa Membership in Mensa requires a score in the...Ch. 6.4 - Designing Manholes According to the website...Ch. 6.4 - Water Taxi Safety Passengers died when a water...Ch. 6.4 - Vending Machines Quarters are now manufactured so...Ch. 6.4 - Southwest Airlines Seats Southwest Airlines...Ch. 6.4 - Coke Cans Assume that cans of Coke are filled so...Ch. 6.4 - Redesign of Ejection Seats When women were finally...Ch. 6.4 - Loading a Tour Boat The Ethan Allen tour boat...Ch. 6.4 - Doorway Height The Boeing 757-200 ER airliner...Ch. 6.4 - Loading Aircraft Before every flight, the pilot...Ch. 6.4 - Correcting for a Finite Population In a study of...Ch. 6.5 - Normal Quantile Plot Data Set 1 Body Data in...Ch. 6.5 - Normal Quantile Plot After constructing a...Ch. 6.5 - Small Sample Data set 29 Coin Weights in Appendix...Ch. 6.5 - Assessing Normality The accompanying histogram is...Ch. 6.5 - Prob. 5BSCCh. 6.5 - Prob. 6BSCCh. 6.5 - Prob. 7BSCCh. 6.5 - Interpreting Normal Quantile Plots. In Exercises...Ch. 6.5 - Prob. 9BSCCh. 6.5 - Determining Normality. In Exercises 912, refer to...Ch. 6.5 - Determining Normality. In Exercises 912, refer to...Ch. 6.5 - Prob. 12BSCCh. 6.5 - Using Technology to Generate Normal Quantile...Ch. 6.5 - Using Technology to Generate Normal Quantile...Ch. 6.5 - Prob. 15BSCCh. 6.5 - Prob. 16BSCCh. 6.5 - Constructing Normal Quantile Plots. In Exercises...Ch. 6.5 - Prob. 18BSCCh. 6.5 - Constructing Normal Quantile Plots. In Exercises...Ch. 6.5 - Constructing Normal Quantile Plots. In Exercises...Ch. 6.5 - Transformations The heights (in inches) of men...Ch. 6.5 - Lognormal Distribution The following are the...Ch. 6.6 - Continuity Correction In testing the assumption...Ch. 6.6 - Checking Requirements Common tests such as the...Ch. 6.6 - Notation Common tests such as the SAT, ACT, LSAT,...Ch. 6.6 - Distribution of Proportions Each week, Nielsen...Ch. 6.6 - Using Normal Approximation. In Exercises 58, do...Ch. 6.6 - Using Normal Approximation. In Exercises 58, do...Ch. 6.6 - Using Normal Approximation. In Exercises 58, do...Ch. 6.6 - Using Normal Approximation. In Exercises 58, do...Ch. 6.6 - Car Colors. In Exercises 912, assume that 100 cars...Ch. 6.6 - Car Colors. In Exercises 912, assume that 100 cars...Ch. 6.6 - Car Colors. In Exercises 912, assume that 100 cars...Ch. 6.6 - Car Colors. In Exercises 912, assume that 100 cars...Ch. 6.6 - Tennis Replay In the year that this exercise was...Ch. 6.6 - Tennis Replay Repeat the preceding exercise after...Ch. 6.6 - Smartphones Based on an LG smartphone survey,...Ch. 6.6 - Eye Color Based on a study by Dr. P. Sorita at...Ch. 6.6 - Mendelian Genetics When Mendel conducted his...Ch. 6.6 - Sleepwalking Assume that 29.2% of people have...Ch. 6.6 - Voters Lying? In a survey of 1002 people, 701 said...Ch. 6.6 - Cell Phones and Brain Cancer In a study of 420,095...Ch. 6.6 - Births The probability of a baby being born a boy...Ch. 6.6 - Overbooking a Boeing 767-300 A Boeing 767-300...Ch. 6 - Bone Density Test. In Exercises 14, assume that...Ch. 6 - Bone Density Test. In Exercises 14, assume that...Ch. 6 - Bone Density Test. In Exercises 14, assume that...Ch. 6 - Bone Density Test. In Exercises 14, assume that...Ch. 6 - Notation a. Identify the values of and for the...Ch. 6 - In Exercises 610, assume that women have diastolic...Ch. 6 - In Exercises 610, assume that women have diastolic...Ch. 6 - In Exercises 610, assume that women have diastolic...Ch. 6 - In Exercises 610, assume that women have diastolic...Ch. 6 - In Exercises 610, assume that women have diastolic...Ch. 6 - Bone Density Test A bone mineral density test is...Ch. 6 - Biometric Security In designing a security system...Ch. 6 - Biometric Security Standing eye heights of men are...Ch. 6 - Sampling Distributions Scores on the Gilliam...Ch. 6 - Unbiased Estimators a. What is an unbiased...Ch. 6 - Disney Monorail The Mark VI monorail used at...Ch. 6 - Disney Monorail Consider the same Mark VI monorail...Ch. 6 - Assessing Normality Listed below are the recent...Ch. 6 - Hybridization Experiment In one of Mendels...Ch. 6 - Tall Clubs The social organization Tall Clubs...Ch. 6 - In Exercises 13, use the following recent annual...Ch. 6 - In Exercises 13, use the following recent annual...Ch. 6 - In Exercises 13, use the following recent annual...Ch. 6 - Blue Eyes Assume that 35% of us have blue eyes...Ch. 6 - Foot Lengths of Women Assume that foot lengths of...Ch. 6 - Assessing Normality It is often necessary to...Ch. 6 - Binomial Probabilities Section 6-6 described a...
Additional Math Textbook Solutions
Find more solutions based on key concepts
Graph the points with the following polar coordinates. Give two alternative representations of the points in po...
Calculus: Early Transcendentals (2nd Edition)
Square root of the given number to the nearest integer using calculator.
Pre-Algebra Student Edition
At what points are the functions in Exercise continuous?
University Calculus: Early Transcendentals (4th Edition)
Women’s Heights Assume that college women’s heights are approximately Normally distributed with a mean of 65 in...
Introductory Statistics
Identify f as being linear, quadratic, or neither. If f is quadratic, identify the leading coefficient a and ...
College Algebra with Modeling & Visualization (5th Edition)
The following set of data is from sample of n=5: a. Compute the mean, median, and mode. b. Compute the range, v...
Basic Business Statistics, Student Value Edition
Knowledge Booster


Learn more about
Need a deep-dive on the concept behind this application? Look no further. Learn more about this topic, statistics and related others by exploring similar questions and additional content below.Similar questions
- At the same restaurant as in Question 19 with the same normal distribution, what's the chance of it taking no more than 15 minutes to get service?arrow_forwardClint, obviously not in college, sleeps an average of 8 hours per night with a standard deviation of 15 minutes. What's the chance of him sleeping between 7.5 and 8.5 hours on any given night? 0-(7-0) 200 91109s and doiw $20 (8-0) mol 8520 slang $199 galbrog seam side pide & D (newid se od poyesvig as PELEO PER AFTE editiw noudab temand van Czarrow_forwardTimes to complete a statistics exam have a normal distribution with a mean of 40 minutes and standard deviation of 6 minutes. Deshawn's time comes in at the 90th percentile. What percentage of the students are still working on their exams when Deshawn leaves?arrow_forward
- Suppose that the weights of cereal boxes have a normal distribution with a mean of 20 ounces and standard deviation of half an ounce. A box that has a standard score of o weighs how much? syed by ilog ni 21arrow_forwardBob scores 80 on both his math exam (which has a mean of 70 and standard deviation of 10) and his English exam (which has a mean of 85 and standard deviation of 5). Find and interpret Bob's Z-scores on both exams to let him know which exam (if either) he did bet- ter on. Don't, however, let his parents know; let them think he's just as good at both subjects. algas 70) sering digarrow_forwardSue's math class exam has a mean of 70 with a standard deviation of 5. Her standard score is-2. What's her original exam score?arrow_forward
- Clint sleeps an average of 8 hours per night with a standard deviation of 15 minutes. What's the chance he will sleep less than 7.5 hours tonight? nut bow visarrow_forwardSuppose that your score on an exam is directly at the mean. What's your standard score?arrow_forwardOne state's annual rainfall has a normal dis- tribution with a mean of 100 inches and standard deviation of 25 inches. Suppose that corn grows best when the annual rainfall is between 100 and 150 inches. What's the chance of achieving this amount of rainfall? wved now of sociarrow_forward
arrow_back_ios
SEE MORE QUESTIONS
arrow_forward_ios
Recommended textbooks for you
 Big Ideas Math A Bridge To Success Algebra 1: Stu...AlgebraISBN:9781680331141Author:HOUGHTON MIFFLIN HARCOURTPublisher:Houghton Mifflin Harcourt
 Holt Mcdougal Larson Pre-algebra: Student Edition...AlgebraISBN:9780547587776Author:HOLT MCDOUGALPublisher:HOLT MCDOUGAL
 Glencoe Algebra 1, Student Edition, 9780079039897...AlgebraISBN:9780079039897Author:CarterPublisher:McGraw Hill
 Trigonometry (MindTap Course List)TrigonometryISBN:9781337278461Author:Ron LarsonPublisher:Cengage Learning
Big Ideas Math A Bridge To Success Algebra 1: Stu...
Algebra
ISBN:9781680331141
Author:HOUGHTON MIFFLIN HARCOURT
Publisher:Houghton Mifflin Harcourt
Holt Mcdougal Larson Pre-algebra: Student Edition...
Algebra
ISBN:9780547587776
Author:HOLT MCDOUGAL
Publisher:HOLT MCDOUGAL
Glencoe Algebra 1, Student Edition, 9780079039897...
Algebra
ISBN:9780079039897
Author:Carter
Publisher:McGraw Hill
Trigonometry (MindTap Course List)
Trigonometry
ISBN:9781337278461
Author:Ron Larson
Publisher:Cengage Learning
Hypothesis Testing - Solving Problems With Proportions; Author: The Organic Chemistry Tutor;https://www.youtube.com/watch?v=76VruarGn2Q;License: Standard YouTube License, CC-BY
Hypothesis Testing and Confidence Intervals (FRM Part 1 – Book 2 – Chapter 5); Author: Analystprep;https://www.youtube.com/watch?v=vth3yZIUlGQ;License: Standard YouTube License, CC-BY