
ESSENTIALS OF STATISTICS 6TH ED W/MYSTA
6th Edition
ISBN: 9781323845820
Author: Triola
Publisher: PEARSON
expand_more
expand_more
format_list_bulleted
Concept explainers
Videos
Textbook Question
Chapter 6.2, Problem 5BSC
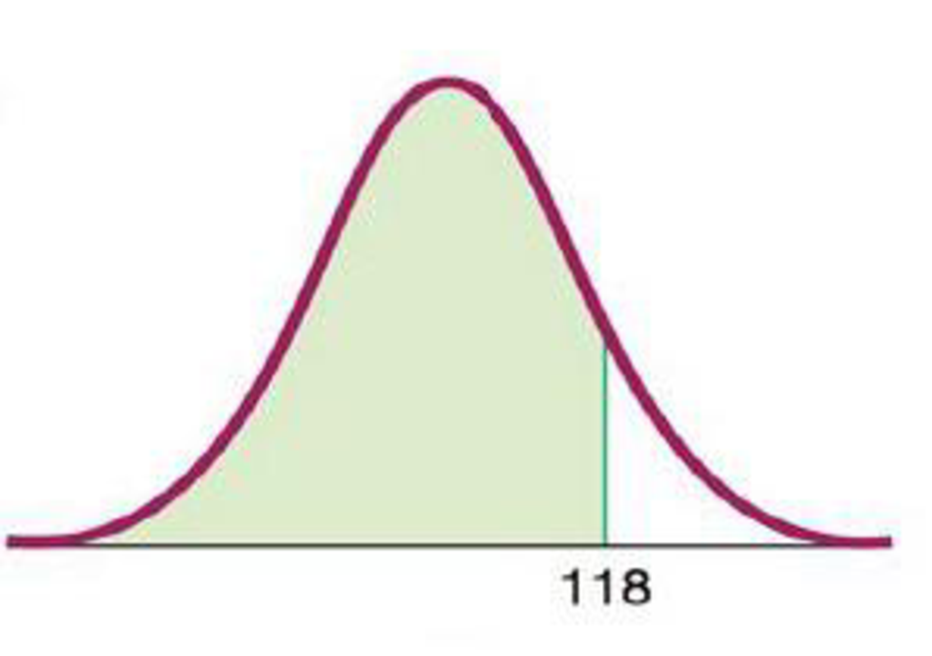
IQ Scores. In Exercises 5–8, find the area of the shaded region. The graphs depict IQ scores of adults, and those scores are
5.
Expert Solution & Answer

Learn your wayIncludes step-by-step video

schedule01:59
Students have asked these similar questions
Suppose you know that Bob's test score is
above the mean, but he doesn't remember by
how much. At least how many students must
score lower than Bob?
If a baby's weight is at the median, what's
her percentile?
At the same restaurant as in Question 19 with
the same normal distribution, what's the
chance of it taking no more than 15 minutes
to get service?
Chapter 6 Solutions
ESSENTIALS OF STATISTICS 6TH ED W/MYSTA
Ch. 6.1 - Normal Distribution Whats wrong with the following...Ch. 6.1 - Normal Distribution A normal distribution is...Ch. 6.1 - Standard Normal Distribution Identify the two...Ch. 6.1 - Notation What does the notation z indicate?Ch. 6.1 - Continuous Uniform Distribution. In Exercises 58,...Ch. 6.1 - Continuous Uniform Distribution. In Exercises 58,...Ch. 6.1 - Continuous Uniform Distribution. In Exercises 58,...Ch. 6.1 - Continuous Uniform Distribution. In Exercises 58,...Ch. 6.1 - Standard Normal Distribution. In Exercises 912,...Ch. 6.1 - Standard Normal Distribution. In Exercises 912,...
Ch. 6.1 - Standard Normal Distribution. In Exercises 912,...Ch. 6.1 - Standard Normal Distribution. In Exercises 912,...Ch. 6.1 - Standard Normal Distribution. In Exercises 1316,...Ch. 6.1 - Standard Normal Distribution. In Exercises 1316,...Ch. 6.1 - Standard Normal Distribution. In Exercises 1316,...Ch. 6.1 - Standard Normal Distribution. In Exercises 1316,...Ch. 6.1 - Standard Normal Distribution. In Exercises 1736,...Ch. 6.1 - Standard Normal Distribution. In Exercises 1736,...Ch. 6.1 - Standard Normal Distribution. In Exercises 1736,...Ch. 6.1 - Standard Normal Distribution. In Exercises 1736,...Ch. 6.1 - Standard Normal Distribution. In Exercises 1736,...Ch. 6.1 - Standard Normal Distribution. In Exercises 1736,...Ch. 6.1 - Standard Normal Distribution. In Exercises 1736,...Ch. 6.1 - Standard Normal Distribution. In Exercises 1736,...Ch. 6.1 - Standard Normal Distribution. In Exercises 1736,...Ch. 6.1 - Standard Normal Distribution. In Exercises 1736,...Ch. 6.1 - Standard Normal Distribution. In Exercises 1736,...Ch. 6.1 - Standard Normal Distribution. In Exercises 1736,...Ch. 6.1 - Standard Normal Distribution. In Exercises 1736,...Ch. 6.1 - Standard Normal Distribution. In Exercises 1736,...Ch. 6.1 - Standard Normal Distribution. In Exercises 1736,...Ch. 6.1 - Standard Normal Distribution. In Exercises 1736,...Ch. 6.1 - Standard Normal Distribution. In Exercises 1736,...Ch. 6.1 - Standard Normal Distribution. In Exercises 1736,...Ch. 6.1 - Standard Normal Distribution. In Exercises 1736,...Ch. 6.1 - Standard Normal Distribution. In Exercises 1736,...Ch. 6.1 - Finding Bone Density Scores. In Exercises 3740...Ch. 6.1 - Finding Bone Density Scores. In Exercises 3740...Ch. 6.1 - Finding Bone Density Scores. In Exercises 3740...Ch. 6.1 - Finding Bone Density Scores. In Exercises 3740...Ch. 6.1 - Critical Values. In Exercises 4144, find the...Ch. 6.1 - Critical Values. In Exercises 4144, find the...Ch. 6.1 - Critical Values. In Exercises 4144, find the...Ch. 6.1 - Critical Values. In Exercises 4144, find the...Ch. 6.1 - Basis for the Range Rule of Thumb and the...Ch. 6.1 - Basis for the Range Rule of Thumb and the...Ch. 6.1 - Basis for the Range Rule of Thumb and the...Ch. 6.1 - Basis for the Range Rule of Thumb and the...Ch. 6.1 - Significance For bone density scores that are...Ch. 6.1 - Distributions In a continuous uniform...Ch. 6.2 - Birth Weights Based on Data Set 4 Births in...Ch. 6.2 - Birth Weights Based on Data Set 4 Births in...Ch. 6.2 - Normal Distributions What is the difference...Ch. 6.2 - Random Digits Computers are commonly used to...Ch. 6.2 - IQ Scores. In Exercises 58, find the area of the...Ch. 6.2 - IQ Scores. In Exercises 58, find the area of the...Ch. 6.2 - IQ Scores. In Exercises 58, find the area of the...Ch. 6.2 - IQ Scores. In Exercises 58, find the area of the...Ch. 6.2 - IQ Scores. In Exercises 912, find the indicated IQ...Ch. 6.2 - IQ Scores. In Exercises 912, find the indicated IQ...Ch. 6.2 - IQ Scores. In Exercises 912, find the indicated IQ...Ch. 6.2 - IQ Scores. In Exercises 912, find the indicated IQ...Ch. 6.2 - Seat Designs. In Exercises 1320, use the data in...Ch. 6.2 - Seat Designs. In Exercises 1320, use the data in...Ch. 6.2 - Seat Designs. In Exercises 1320, use the data in...Ch. 6.2 - Seat Designs. In Exercises 1320, use the data in...Ch. 6.2 - Seat Designs. In Exercises 1320, use the data in...Ch. 6.2 - Seat Designs. In Exercises 1320, use the data in...Ch. 6.2 - Seat Designs. In Exercises 1320, use the data in...Ch. 6.2 - Seat Designs. In Exercises 1320, use the data in...Ch. 6.2 - In Exercises 2124, use these parameters (based on...Ch. 6.2 - In Exercises 2124, use these parameters (based on...Ch. 6.2 - In Exercises 2124, use these parameters (based on...Ch. 6.2 - In Exercises 2124, use these parameters (based on...Ch. 6.2 - Eye Contact In a study of facial behavior, people...Ch. 6.2 - Designing a Work Station A common design...Ch. 6.2 - Jet Ejection Seats The U.S. Air Force once used...Ch. 6.2 - Quarters After 1964, quarters were manufactured so...Ch. 6.2 - Low Birth Weight The University of Maryland...Ch. 6.2 - Body Temperatures Based on the sample results in...Ch. 6.2 - Durations of Pregnancies The lengths of...Ch. 6.2 - Water Taxi Safety When a water taxi sank in...Ch. 6.2 - Curving Test Scores A professor gives a test and...Ch. 6.2 - Outliers For the purposes of constructing modified...Ch. 6.3 - Births There are about 11,000 births each day in...Ch. 6.3 - Sampling with Replacement The Orangetown Medical...Ch. 6.3 - Unbiased Estimators Data Set 4 Births in Appendix...Ch. 6.3 - Sampling Distribution Data Set 4 Births in...Ch. 6.3 - Good Sample? A geneticist is investigating the...Ch. 6.3 - College Presidents There are about 4200 college...Ch. 6.3 - In Exercises 710, use the same population of {4,...Ch. 6.3 - In Exercises 710, use the same population of {4,...Ch. 6.3 - In Exercises 710, use the same population of {4,...Ch. 6.3 - In Exercises 710, use the same population of {4,...Ch. 6.3 - In Exercises 1114, use the population of {34, 36,...Ch. 6.3 - In Exercises 1114, use the population of {34, 36,...Ch. 6.3 - In Exercises 1114, use the population of {34, 36,...Ch. 6.3 - In Exercises 1114, use the population of {34, 36,...Ch. 6.3 - Births: Sampling Distribution of Sample Proportion...Ch. 6.3 - Births: Sampling Distribution of Sample Proportion...Ch. 6.3 - SAT and ACT Tests Because they enable efficient...Ch. 6.3 - Hybridization A hybridization experiment begins...Ch. 6.3 - Using a Formula to Describe a Sampling...Ch. 6.3 - Mean Absolute Deviation Is the mean absolute...Ch. 6.4 - Requirements A researcher collects a simple random...Ch. 6.4 - Small Sample Weights of golden retriever dogs are...Ch. 6.4 - Notation In general, what do the symbols x and x...Ch. 6.4 - Annual Incomes Annual incomes are known to have a...Ch. 6.4 - Using the Central Limit Theorem. In Exercises 58,...Ch. 6.4 - Using the Central Limit Theorem. In Exercises 58,...Ch. 6.4 - Using the Central Limit Theorem. In Exercises 58,...Ch. 6.4 - Using the Central Limit Theorem. In Exercises 58,...Ch. 6.4 - Elevator Safety Example 2 referred to an elevator...Ch. 6.4 - Elevator Safety Exercise 9 uses = 189 lb, which...Ch. 6.4 - Mensa Membership in Mensa requires a score in the...Ch. 6.4 - Designing Manholes According to the website...Ch. 6.4 - Water Taxi Safety Passengers died when a water...Ch. 6.4 - Vending Machines Quarters are now manufactured so...Ch. 6.4 - Southwest Airlines Seats Southwest Airlines...Ch. 6.4 - Coke Cans Assume that cans of Coke are filled so...Ch. 6.4 - Redesign of Ejection Seats When women were finally...Ch. 6.4 - Loading a Tour Boat The Ethan Allen tour boat...Ch. 6.4 - Doorway Height The Boeing 757-200 ER airliner...Ch. 6.4 - Loading Aircraft Before every flight, the pilot...Ch. 6.4 - Correcting for a Finite Population In a study of...Ch. 6.5 - Normal Quantile Plot Data Set 1 Body Data in...Ch. 6.5 - Normal Quantile Plot After constructing a...Ch. 6.5 - Small Sample Data set 29 Coin Weights in Appendix...Ch. 6.5 - Assessing Normality The accompanying histogram is...Ch. 6.5 - Prob. 5BSCCh. 6.5 - Prob. 6BSCCh. 6.5 - Prob. 7BSCCh. 6.5 - Interpreting Normal Quantile Plots. In Exercises...Ch. 6.5 - Prob. 9BSCCh. 6.5 - Constructing Normal Quantile Plots. In Exercises...Ch. 6.5 - Prob. 18BSCCh. 6.5 - Constructing Normal Quantile Plots. In Exercises...Ch. 6.5 - Constructing Normal Quantile Plots. In Exercises...Ch. 6.5 - Transformations The heights (in inches) of men...Ch. 6.5 - Lognormal Distribution The following are the...Ch. 6.6 - Continuity Correction In testing the assumption...Ch. 6.6 - Checking Requirements Common tests such as the...Ch. 6.6 - Notation Common tests such as the SAT, ACT, LSAT,...Ch. 6.6 - Distribution of Proportions Each week, Nielsen...Ch. 6.6 - Using Normal Approximation. In Exercises 58, do...Ch. 6.6 - Using Normal Approximation. In Exercises 58, do...Ch. 6.6 - Using Normal Approximation. In Exercises 58, do...Ch. 6.6 - Using Normal Approximation. In Exercises 58, do...Ch. 6.6 - Car Colors. In Exercises 912, assume that 100 cars...Ch. 6.6 - Car Colors. In Exercises 912, assume that 100 cars...Ch. 6.6 - Car Colors. In Exercises 912, assume that 100 cars...Ch. 6.6 - Car Colors. In Exercises 912, assume that 100 cars...Ch. 6.6 - Tennis Replay In the year that this exercise was...Ch. 6.6 - Tennis Replay Repeat the preceding exercise after...Ch. 6.6 - Smartphones Based on an LG smartphone survey,...Ch. 6.6 - Eye Color Based on a study by Dr. P. Sorita at...Ch. 6.6 - Mendelian Genetics When Mendel conducted his...Ch. 6.6 - Sleepwalking Assume that 29.2% of people have...Ch. 6.6 - Voters Lying? In a survey of 1002 people, 701 said...Ch. 6.6 - Cell Phones and Brain Cancer In a study of 420,095...Ch. 6.6 - Births The probability of a baby being born a boy...Ch. 6.6 - Overbooking a Boeing 767-300 A Boeing 767-300...Ch. 6 - Bone Density Test. In Exercises 14, assume that...Ch. 6 - Bone Density Test. In Exercises 14, assume that...Ch. 6 - Bone Density Test. In Exercises 14, assume that...Ch. 6 - Bone Density Test. In Exercises 14, assume that...Ch. 6 - Notation a. Identify the values of and for the...Ch. 6 - In Exercises 610, assume that women have diastolic...Ch. 6 - In Exercises 610, assume that women have diastolic...Ch. 6 - In Exercises 610, assume that women have diastolic...Ch. 6 - In Exercises 610, assume that women have diastolic...Ch. 6 - In Exercises 610, assume that women have diastolic...Ch. 6 - Bone Density Test A bone mineral density test is...Ch. 6 - Biometric Security In designing a security system...Ch. 6 - Biometric Security Standing eye heights of men are...Ch. 6 - Sampling Distributions Scores on the Gilliam...Ch. 6 - Unbiased Estimators a. What is an unbiased...Ch. 6 - Disney Monorail The Mark VI monorail used at...Ch. 6 - Disney Monorail Consider the same Mark VI monorail...Ch. 6 - Assessing Normality Listed below are the recent...Ch. 6 - Hybridization Experiment In one of Mendels...Ch. 6 - Tall Clubs The social organization Tall Clubs...Ch. 6 - In Exercises 13, use the following recent annual...Ch. 6 - In Exercises 13, use the following recent annual...Ch. 6 - In Exercises 13, use the following recent annual...Ch. 6 - Blue Eyes Assume that 35% of us have blue eyes...Ch. 6 - Foot Lengths of Women Assume that foot lengths of...Ch. 6 - Assessing Normality It is often necessary to...
Additional Math Textbook Solutions
Find more solutions based on key concepts
CHECK POINT 1 In a survey on musical tastes, respondents were asked: Do you listed to classical music? Do you l...
Thinking Mathematically (6th Edition)
Which of the sequences {an} in Exercises 31–100 converge, and which diverge? Find the limit of each convergent ...
University Calculus: Early Transcendentals (4th Edition)
Moving shadow A 5-foot-tall woman walks at 8 ft/s toward a streetlight that is 20 ft above the ground. What is ...
Calculus: Early Transcendentals (2nd Edition)
Explain the meaning of the term “statistically significant difference” in statistics terminology.
Intro Stats, Books a la Carte Edition (5th Edition)
Fill in each blank so that the resulting statement is true. The quadratic function f(x)=a(xh)2+k,a0, is in ____...
Algebra and Trigonometry (6th Edition)
3. For the same sample statistics, which level of confidence would produce the widest confidence interval? Expl...
Elementary Statistics: Picturing the World (7th Edition)
Knowledge Booster


Learn more about
Need a deep-dive on the concept behind this application? Look no further. Learn more about this topic, statistics and related others by exploring similar questions and additional content below.Similar questions
- Clint, obviously not in college, sleeps an average of 8 hours per night with a standard deviation of 15 minutes. What's the chance of him sleeping between 7.5 and 8.5 hours on any given night? 0-(7-0) 200 91109s and doiw $20 (8-0) mol 8520 slang $199 galbrog seam side pide & D (newid se od poyesvig as PELEO PER AFTE editiw noudab temand van Czarrow_forwardTimes to complete a statistics exam have a normal distribution with a mean of 40 minutes and standard deviation of 6 minutes. Deshawn's time comes in at the 90th percentile. What percentage of the students are still working on their exams when Deshawn leaves?arrow_forwardSuppose that the weights of cereal boxes have a normal distribution with a mean of 20 ounces and standard deviation of half an ounce. A box that has a standard score of o weighs how much? syed by ilog ni 21arrow_forward
- Bob scores 80 on both his math exam (which has a mean of 70 and standard deviation of 10) and his English exam (which has a mean of 85 and standard deviation of 5). Find and interpret Bob's Z-scores on both exams to let him know which exam (if either) he did bet- ter on. Don't, however, let his parents know; let them think he's just as good at both subjects. algas 70) sering digarrow_forwardSue's math class exam has a mean of 70 with a standard deviation of 5. Her standard score is-2. What's her original exam score?arrow_forwardClint sleeps an average of 8 hours per night with a standard deviation of 15 minutes. What's the chance he will sleep less than 7.5 hours tonight? nut bow visarrow_forward
- Suppose that your score on an exam is directly at the mean. What's your standard score?arrow_forwardOne state's annual rainfall has a normal dis- tribution with a mean of 100 inches and standard deviation of 25 inches. Suppose that corn grows best when the annual rainfall is between 100 and 150 inches. What's the chance of achieving this amount of rainfall? wved now of sociarrow_forward13 Suppose that your exam score has a standard score of 0.90. Does this mean that 90 percent of the other exam scores are lower than yours?arrow_forward
- Bob's commuting times to work have a nor- mal distribution with a mean of 45 minutes and standard deviation of 10 minutes. How often does Bob get to work in 30 to 45 minutes?arrow_forwardBob's commuting times to work have a nor- mal distribution with a mean of 45 minutes and standard deviation of 10 minutes. a. What percentage of the time does Bob get to work in 30 minutes or less? b. Bob's workday starts at 9 a.m. If he leaves at 8 a.m., how often is he late?arrow_forwardSuppose that you want to put fat Fido on a weight-loss program. Before the program, his weight had a standard score of +2 com- pared to dogs of his breed/age, and after the program, his weight has a standard score of -2. His weight before the program was 150 pounds, and the standard deviation for the breed is 5 pounds. a. What's the mean weight for Fido's breed/ age? b. What's his weight after the weight-loss program?arrow_forward
arrow_back_ios
SEE MORE QUESTIONS
arrow_forward_ios
Recommended textbooks for you
 Big Ideas Math A Bridge To Success Algebra 1: Stu...AlgebraISBN:9781680331141Author:HOUGHTON MIFFLIN HARCOURTPublisher:Houghton Mifflin Harcourt
 Holt Mcdougal Larson Pre-algebra: Student Edition...AlgebraISBN:9780547587776Author:HOLT MCDOUGALPublisher:HOLT MCDOUGAL
 Glencoe Algebra 1, Student Edition, 9780079039897...AlgebraISBN:9780079039897Author:CarterPublisher:McGraw Hill
 Trigonometry (MindTap Course List)TrigonometryISBN:9781337278461Author:Ron LarsonPublisher:Cengage Learning
Big Ideas Math A Bridge To Success Algebra 1: Stu...
Algebra
ISBN:9781680331141
Author:HOUGHTON MIFFLIN HARCOURT
Publisher:Houghton Mifflin Harcourt
Holt Mcdougal Larson Pre-algebra: Student Edition...
Algebra
ISBN:9780547587776
Author:HOLT MCDOUGAL
Publisher:HOLT MCDOUGAL
Glencoe Algebra 1, Student Edition, 9780079039897...
Algebra
ISBN:9780079039897
Author:Carter
Publisher:McGraw Hill
Trigonometry (MindTap Course List)
Trigonometry
ISBN:9781337278461
Author:Ron Larson
Publisher:Cengage Learning
Hypothesis Testing - Solving Problems With Proportions; Author: The Organic Chemistry Tutor;https://www.youtube.com/watch?v=76VruarGn2Q;License: Standard YouTube License, CC-BY
Hypothesis Testing and Confidence Intervals (FRM Part 1 – Book 2 – Chapter 5); Author: Analystprep;https://www.youtube.com/watch?v=vth3yZIUlGQ;License: Standard YouTube License, CC-BY