
EBK ELEMENTARY STATISTICS
7th Edition
ISBN: 9780134684291
Author: Larson
Publisher: PEARSON CO
expand_more
expand_more
format_list_bulleted
Concept explainers
Videos
Textbook Question
Chapter 6.2, Problem 32E
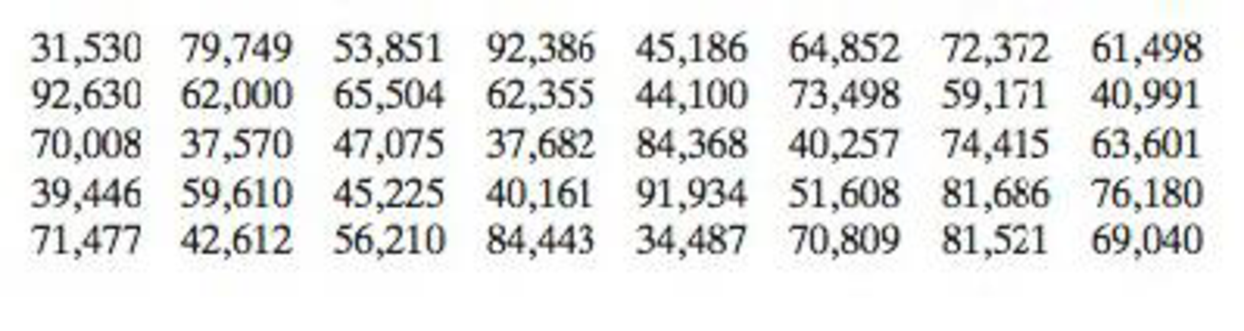
Constructing a Confidence Interval Ir. Exercises 31 and 32, use the data set to (a) find the sample
32. Earnings The annual earnings (in dollars) of 40 randomly selected intermediate level life insurance underwriters (Adapted from Salary.com)
Expert Solution & Answer
Want to see the full answer?
Check out a sample textbook solution
Students have asked these similar questions
II Consider the following data matrix X:
X1
X2
0.5
0.4
0.2 0.5
0.5
0.5
10.3 10
10.1 10.4
10.1
10.5
What will the resulting clusters be when using the k-Means method with k = 2. In your own words, explain why this result is
indeed expected, i.e. why this clustering minimises the ESS map.
why the answer is 3 and 10?
PS
9 Two films are shown on screen A and screen B at a cinema each evening. The numbers
of people viewing the films on 12 consecutive evenings are shown in the back-to-back
stem-and-leaf diagram.
Screen A (12) Screen B (12)
8
037
34
7 6 4 0 534
74 1645678
92 71689
Key: 116|4 represents 61 viewers for A and 64 viewers for B
A second stem-and-leaf diagram (with rows of the same width as the previous diagram)
is drawn showing the total number of people viewing films at the cinema on each of
these 12 evenings. Find the least and greatest possible number of rows that this second
diagram could have.
TIP
On the evening when 30 people viewed films on screen A, there could have been as few
as 37 or as many as 79 people viewing films on screen B.
Chapter 6 Solutions
EBK ELEMENTARY STATISTICS
Ch. 6.1 - In Example 1, the researcher selects a second...Ch. 6.1 - Use the data in Try It Yourself 1 and a 95%...Ch. 6.1 - Use the data in Try It Yourself 1 to construct a...Ch. 6.1 - Use the data in Example 1 and technology to...Ch. 6.1 - Construct a 90% confidence interval for the...Ch. 6.1 - In Example 6, how many student-athletes must the...Ch. 6.1 - When estimating a population mean, are you more...Ch. 6.1 - Which statistic is the best unbiased estimator for...Ch. 6.1 - For the same sample statistics, which level of...Ch. 6.1 - You construct a 95% confidence interval for a...
Ch. 6.1 - In Exercises 58, find the critical value Zc...Ch. 6.1 - In Exercises 58, find the critical value Zc...Ch. 6.1 - In Exercises 58, find the critical value Zc...Ch. 6.1 - In Exercises 58, find the critical value Zc...Ch. 6.1 - Graphical Analysis In Exercises 912, use the...Ch. 6.1 - Graphical Analysis In Exercises 912, use the...Ch. 6.1 - Graphical Analysis In Exercises 912, use the...Ch. 6.1 - Graphical Analysis In Exercises 912, use the...Ch. 6.1 - In Exercises 1316, find the margin of error for...Ch. 6.1 - In Exercises 1316, find the margin of error for...Ch. 6.1 - In Exercises 1316, find the margin of error for...Ch. 6.1 - In Exercises 1316, find the margin of error for...Ch. 6.1 - Matching In Exercises 1720, match the level of...Ch. 6.1 - Matching In Exercises 1720, match the level of...Ch. 6.1 - Matching In Exercises 1720, match the level of...Ch. 6.1 - Matching In Exercises 1720, match the level of...Ch. 6.1 - In Exercises 2124, construct the indicated...Ch. 6.1 - In Exercises 2124, construct the indicated...Ch. 6.1 - In Exercises 2124, construct the indicated...Ch. 6.1 - In Exercises 2124, construct the indicated...Ch. 6.1 - In Exercises 2528, use the confidence interval to...Ch. 6.1 - In Exercises 2528, use the confidence interval to...Ch. 6.1 - In Exercises 2528, use the confidence interval to...Ch. 6.1 - In Exercises 2528, use the confidence interval to...Ch. 6.1 - In Exercises 2932, determine the minimum sample...Ch. 6.1 - In Exercises 2932, determine the minimum sample...Ch. 6.1 - In Exercises 2932, determine the minimum sample...Ch. 6.1 - In Exercises 2932, determine the minimum sample...Ch. 6.1 - Finding the Margin of Error In Exercises 33 and...Ch. 6.1 - Finding the Margin of Error In Exercises 33 and...Ch. 6.1 - Constructing Confidence Intervals In Exercises...Ch. 6.1 - Constructing Confidence Intervals In Exercises...Ch. 6.1 - Constructing Confidence Intervals In Exercises...Ch. 6.1 - Constructing Confidence Intervals In Exercises...Ch. 6.1 - In Exercise 35, does it seem possible that the...Ch. 6.1 - In Exercise 36, does it seem possible that the...Ch. 6.1 - In Exercise 37, does it seem possible that the...Ch. 6.1 - In Exercise 38, does it seem possible that the...Ch. 6.1 - When all other quantities remain the same, how...Ch. 6.1 - Constructing Confidence Intervals In Exercises 45...Ch. 6.1 - Constructing Confidence Intervals In Exercises 45...Ch. 6.1 - Determining a Minimum Sample Size Determine the...Ch. 6.1 - Determining a Minimum Sample Size Determine the...Ch. 6.1 - Cholesterol Contents of Cheese A cheese processing...Ch. 6.1 - Ages of College Students An admissions director...Ch. 6.1 - Paint Can Volumes A paint manufacturer uses a...Ch. 6.1 - Juice Dispensing Machine A beverage company uses a...Ch. 6.1 - Soccer Balls A soccer ball manufacturer wants to...Ch. 6.1 - Tennis Balls A tennis ball manufacturer wants to...Ch. 6.1 - When estimating the population mean, why not...Ch. 6.1 - When all other quantities remain the same, how...Ch. 6.1 - Determine the finite population coection factor...Ch. 6.1 - Use the finite population correction factor to...Ch. 6.1 - Sample Size The equation for determining the...Ch. 6.2 - Find the critical value tc for a 90% confidence...Ch. 6.2 - Construct 90% and 99% confidence intervals for the...Ch. 6.2 - Construct 90% and 95% confidence intervals for the...Ch. 6.2 - You randomly select 18 adult male athletes and...Ch. 6.2 - Finding Critical Values of t In Exercises 14, find...Ch. 6.2 - Finding Critical Values of t In Exercises 14, find...Ch. 6.2 - Finding Critical Values of t In Exercises 14, find...Ch. 6.2 - Finding Critical Values of t In Exercises 14, find...Ch. 6.2 - In Exercises 58, find the margin of error for the...Ch. 6.2 - In Exercises 58, find the margin of error for the...Ch. 6.2 - In Exercises 58, find the margin of error for the...Ch. 6.2 - In Exercises 58, find the margin of error for the...Ch. 6.2 - In Exercises 912, construct the indicated...Ch. 6.2 - In Exercises 912, construct the indicated...Ch. 6.2 - In Exercises 912, construct the indicated...Ch. 6.2 - In Exercises 912, construct the indicated...Ch. 6.2 - In Exercises 1316, use the confidence interval to...Ch. 6.2 - In Exercises 1316, use the confidence interval to...Ch. 6.2 - In Exercises 1316, use the confidence interval to...Ch. 6.2 - In Exercises 1316, use the confidence interval to...Ch. 6.2 - Constructing a Confidence Interval In Exercises...Ch. 6.2 - Constructing a Confidence Interval In Exercises...Ch. 6.2 - Constructing a Confidence Interval In Exercises...Ch. 6.2 - Constructing a Confidence Interval In Exercises...Ch. 6.2 - You research commute times to work and find that...Ch. 6.2 - You research driving distances to work and find...Ch. 6.2 - You research prices of cell phones and find that...Ch. 6.2 - You research repair costs of mobile devices and...Ch. 6.2 - Constructing a Confidence Interval in Exercises...Ch. 6.2 - Constructing a Confidence Interval in Exercises...Ch. 6.2 - Constructing a Confidence Interval in Exercises...Ch. 6.2 - Constructing a Confidence Interval in Exercises...Ch. 6.2 - In Exercise 25, the population mean SAT score is...Ch. 6.2 - In Exercise 28, the population mean weekly time...Ch. 6.2 - Constructing a Confidence Interval Ir. Exercises...Ch. 6.2 - Constructing a Confidence Interval Ir. Exercises...Ch. 6.2 - In Exercise 31, the population mean salary is...Ch. 6.2 - In Exercise 32, the population mean salary is...Ch. 6.2 - Choosing a Distribution In Exercises 3538, use the...Ch. 6.2 - Choosing a Distribution In Exercises 3538, use the...Ch. 6.2 - Choosing a Distribution In Exercises 3538, use the...Ch. 6.2 - Choosing a Distribution In Exercises 3538, use the...Ch. 6.2 - In Exercise 36, does it seem possible that the...Ch. 6.2 - In Exercise 38, does it seem possible that the...Ch. 6.2 - Tennis Ball Manufacturing A company manufactures...Ch. 6.2 - Light Bulb Manufacturing A company manufactures...Ch. 6.2 - Prob. 1ACh. 6.2 - In a random sample of 24 high school students, the...Ch. 6.2 - A marathon is a fool race with a distance of 26.22...Ch. 6.2 - A marathon is a fool race with a distance of 26.22...Ch. 6.2 - A marathon is a fool race with a distance of 26.22...Ch. 6.2 - A marathon is a fool race with a distance of 26.22...Ch. 6.2 - A marathon is a fool race with a distance of 26.22...Ch. 6.2 - A marathon is a fool race with a distance of 26.22...Ch. 6.3 - A poll surveyed 4780 U.S. adults about how often...Ch. 6.3 - Use the data in Try It Yourself 1 to construct a...Ch. 6.3 - Use the data in Example 3 to construct a 99%...Ch. 6.3 - A researcher is estimating the population...Ch. 6.3 - True or False? In Exercises 1 and 2, determine...Ch. 6.3 - True or False? In Exercises 1 and 2, determine...Ch. 6.3 - Finding p and q In Exercises 36, let p be the...Ch. 6.3 - Finding p and q In Exercises 36, let p be the...Ch. 6.3 - Finding p and q In Exercises 36, let p be the...Ch. 6.3 - Finding p and q In Exercises 36, let p be the...Ch. 6.3 - In Exercises 710, use the confidence interval to...Ch. 6.3 - In Exercises 710, use the confidence interval to...Ch. 6.3 - In Exercises 710, use the confidence interval to...Ch. 6.3 - In Exercises 710, use the confidence interval to...Ch. 6.3 - Constructing Confidence Intervals In Exercises 11...Ch. 6.3 - Constructing Confidence Intervals In Exercises 11...Ch. 6.3 - Constructing Confidence Intervals In Exercises 13...Ch. 6.3 - Constructing Confidence Intervals In Exercises 13...Ch. 6.3 - LGBT Identification In a survey of 1,626,773 U.S....Ch. 6.3 - Transgender Bathroom Policy In a survey of 1000...Ch. 6.3 - Congress You wish to estimate, with 95%...Ch. 6.3 - Genetically Modified Organisms You wish to...Ch. 6.3 - Fast Food You wish to estimate, with 90%...Ch. 6.3 - Alcohol-Impaired Driving You wish to estimate,...Ch. 6.3 - In Exercise 11, does it seem possible that the...Ch. 6.3 - In Exercise 14, does it seem possible that the...Ch. 6.3 - In Exercise 17(b), would a sample size of 200 be...Ch. 6.3 - In Exercise 20(b), would a sample size of 600 be...Ch. 6.3 - Constructing Confidence Intervals In Exercises 25...Ch. 6.3 - Constructing Confidence Intervals In Exercises 25...Ch. 6.3 - Constructing Confidence Intervals In Exercises 27...Ch. 6.3 - Constructing Confidence Intervals In Exercises 27...Ch. 6.3 - Translating Statements In Exercises 2934,...Ch. 6.3 - Translating Statements In Exercises 2934,...Ch. 6.3 - Prob. 31ECh. 6.3 - Translating Statements In Exercises 2934,...Ch. 6.3 - Prob. 33ECh. 6.3 - Prob. 34ECh. 6.3 - Prob. 35ECh. 6.3 - Prob. 36ECh. 6.3 - Prob. 37ECh. 6.3 - Prob. 1ACh. 6.3 - Prob. 2ACh. 6.4 - Kind the critical values R2 and I2 for a 90%...Ch. 6.4 - Construct the 90% and 95% confidence intervals for...Ch. 6.4 - Does a population have to be normally distributed...Ch. 6.4 - What happens to the shape of the chi-square...Ch. 6.4 - Prob. 3ECh. 6.4 - Finding Critical Values for X2 In Exercises 38,...Ch. 6.4 - Prob. 5ECh. 6.4 - Finding Critical Values for X2 In Exercises 38,...Ch. 6.4 - Finding Critical Values for X2 In Exercises 38,...Ch. 6.4 - Prob. 8ECh. 6.4 - Prob. 9ECh. 6.4 - Prob. 10ECh. 6.4 - Prob. 11ECh. 6.4 - In Exercises 912, construct the indicated...Ch. 6.4 - Prob. 13ECh. 6.4 - Constructing Confidence Intervals In Exercises...Ch. 6.4 - Constructing Confidence Intervals In Exercises...Ch. 6.4 - Constructing Confidence Intervals In Exercises...Ch. 6.4 - Constructing Confidence Intervals In Exercises...Ch. 6.4 - Constructing Confidence Intervals In Exercises...Ch. 6.4 - Constructing Confidence Intervals In Exercises...Ch. 6.4 - Constructing Confidence Intervals In Exercises...Ch. 6.4 - Constructing Confidence Intervals In Exercises...Ch. 6.4 - Constructing Confidence Intervals In Exercises...Ch. 6.4 - Constructing Confidence Intervals In Exercises...Ch. 6.4 - Constructing Confidence Intervals In Exercises...Ch. 6.4 - Prob. 25ECh. 6.4 - Prob. 26ECh. 6.4 - Prob. 27ECh. 6.4 - Prob. 28ECh. 6.4 - Prob. 29ECh. 6 - The waking times (in minutes past 5:00 A.M.) of 40...Ch. 6 - The driving distances (in miles) to work of 30...Ch. 6 - Prob. 6.1.3RECh. 6 - Prob. 6.1.4RECh. 6 - In Exercises 5 and 6, use the confidence interval...Ch. 6 - Prob. 6.1.6RECh. 6 - Prob. 6.1.7RECh. 6 - Prob. 6.1.8RECh. 6 - In Exercises 912, find the critical value tc for...Ch. 6 - In Exercises 912, find the critical value tc for...Ch. 6 - In Exercises 912, find the critical value tc for...Ch. 6 - Prob. 6.2.12RECh. 6 - Prob. 6.2.13RECh. 6 - Prob. 6.2.14RECh. 6 - Prob. 6.2.15RECh. 6 - Prob. 6.2.16RECh. 6 - Prob. 6.2.17RECh. 6 - Prob. 6.2.18RECh. 6 - In Exercises 19-22, let p be the population...Ch. 6 - Prob. 6.3.20RECh. 6 - In Exercises 19-22, let p be the population...Ch. 6 - Prob. 6.3.22RECh. 6 - In Exercise 19, does it seem possible that the...Ch. 6 - Prob. 6.3.24RECh. 6 - Prob. 6.3.25RECh. 6 - Prob. 6.3.26RECh. 6 - Prob. 6.4.27RECh. 6 - Prob. 6.4.28RECh. 6 - Prob. 6.4.29RECh. 6 - In Exercises 2730, find the critical values R2 and...Ch. 6 - Prob. 6.4.31RECh. 6 - In Exercises 31 and 32, assume the sample is from...Ch. 6 - The winning times (in hours) for a sample of 30...Ch. 6 - The data set represents the amounts of time (in...Ch. 6 - Prob. 4CQCh. 6 - Prob. 5CQCh. 6 - Prob. 6CQCh. 6 - Refer to the data set in Exercise 3. Assume the...Ch. 6 - In a survey of 20% U.S. adults, 1740 think...Ch. 6 - The data set represents the weights (in pounds) of...Ch. 6 - The data set represents the scores of 12 randomly...Ch. 6 - Use the standard normal distribution or the...Ch. 6 - The Safe Drinking Water Act, which was passed in...Ch. 6 - The Safe Drinking Water Act, which was passed in...Ch. 6 - The Safe Drinking Water Act, which was passed in...Ch. 6 - Since 1935, the Gallup Organization has conducted...Ch. 6 - THE GALLUP ORGANIZATION www.gallup.com Since 1935,...Ch. 6 - Since 1935, the Gallup Organization has conducted...Ch. 6 - Since 1935, the Gallup Organization has conducted...
Knowledge Booster


Learn more about
Need a deep-dive on the concept behind this application? Look no further. Learn more about this topic, statistics and related others by exploring similar questions and additional content below.Similar questions
- Q.2.4 There are twelve (12) teams participating in a pub quiz. What is the probability of correctly predicting the top three teams at the end of the competition, in the correct order? Give your final answer as a fraction in its simplest form.arrow_forwardThe table below indicates the number of years of experience of a sample of employees who work on a particular production line and the corresponding number of units of a good that each employee produced last month. Years of Experience (x) Number of Goods (y) 11 63 5 57 1 48 4 54 5 45 3 51 Q.1.1 By completing the table below and then applying the relevant formulae, determine the line of best fit for this bivariate data set. Do NOT change the units for the variables. X y X2 xy Ex= Ey= EX2 EXY= Q.1.2 Estimate the number of units of the good that would have been produced last month by an employee with 8 years of experience. Q.1.3 Using your calculator, determine the coefficient of correlation for the data set. Interpret your answer. Q.1.4 Compute the coefficient of determination for the data set. Interpret your answer.arrow_forwardCan you answer this question for mearrow_forward
- Techniques QUAT6221 2025 PT B... TM Tabudi Maphoru Activities Assessments Class Progress lIE Library • Help v The table below shows the prices (R) and quantities (kg) of rice, meat and potatoes items bought during 2013 and 2014: 2013 2014 P1Qo PoQo Q1Po P1Q1 Price Ро Quantity Qo Price P1 Quantity Q1 Rice 7 80 6 70 480 560 490 420 Meat 30 50 35 60 1 750 1 500 1 800 2 100 Potatoes 3 100 3 100 300 300 300 300 TOTAL 40 230 44 230 2 530 2 360 2 590 2 820 Instructions: 1 Corall dawn to tha bottom of thir ceraan urina se se tha haca nariad in archerca antarand cubmit Q Search ENG US 口X 2025/05arrow_forwardThe table below indicates the number of years of experience of a sample of employees who work on a particular production line and the corresponding number of units of a good that each employee produced last month. Years of Experience (x) Number of Goods (y) 11 63 5 57 1 48 4 54 45 3 51 Q.1.1 By completing the table below and then applying the relevant formulae, determine the line of best fit for this bivariate data set. Do NOT change the units for the variables. X y X2 xy Ex= Ey= EX2 EXY= Q.1.2 Estimate the number of units of the good that would have been produced last month by an employee with 8 years of experience. Q.1.3 Using your calculator, determine the coefficient of correlation for the data set. Interpret your answer. Q.1.4 Compute the coefficient of determination for the data set. Interpret your answer.arrow_forwardQ.3.2 A sample of consumers was asked to name their favourite fruit. The results regarding the popularity of the different fruits are given in the following table. Type of Fruit Number of Consumers Banana 25 Apple 20 Orange 5 TOTAL 50 Draw a bar chart to graphically illustrate the results given in the table.arrow_forward
- Q.2.3 The probability that a randomly selected employee of Company Z is female is 0.75. The probability that an employee of the same company works in the Production department, given that the employee is female, is 0.25. What is the probability that a randomly selected employee of the company will be female and will work in the Production department? Q.2.4 There are twelve (12) teams participating in a pub quiz. What is the probability of correctly predicting the top three teams at the end of the competition, in the correct order? Give your final answer as a fraction in its simplest form.arrow_forwardQ.2.1 A bag contains 13 red and 9 green marbles. You are asked to select two (2) marbles from the bag. The first marble selected will not be placed back into the bag. Q.2.1.1 Construct a probability tree to indicate the various possible outcomes and their probabilities (as fractions). Q.2.1.2 What is the probability that the two selected marbles will be the same colour? Q.2.2 The following contingency table gives the results of a sample survey of South African male and female respondents with regard to their preferred brand of sports watch: PREFERRED BRAND OF SPORTS WATCH Samsung Apple Garmin TOTAL No. of Females 30 100 40 170 No. of Males 75 125 80 280 TOTAL 105 225 120 450 Q.2.2.1 What is the probability of randomly selecting a respondent from the sample who prefers Garmin? Q.2.2.2 What is the probability of randomly selecting a respondent from the sample who is not female? Q.2.2.3 What is the probability of randomly…arrow_forwardTest the claim that a student's pulse rate is different when taking a quiz than attending a regular class. The mean pulse rate difference is 2.7 with 10 students. Use a significance level of 0.005. Pulse rate difference(Quiz - Lecture) 2 -1 5 -8 1 20 15 -4 9 -12arrow_forward
- The following ordered data list shows the data speeds for cell phones used by a telephone company at an airport: A. Calculate the Measures of Central Tendency from the ungrouped data list. B. Group the data in an appropriate frequency table. C. Calculate the Measures of Central Tendency using the table in point B. D. Are there differences in the measurements obtained in A and C? Why (give at least one justified reason)? I leave the answers to A and B to resolve the remaining two. 0.8 1.4 1.8 1.9 3.2 3.6 4.5 4.5 4.6 6.2 6.5 7.7 7.9 9.9 10.2 10.3 10.9 11.1 11.1 11.6 11.8 12.0 13.1 13.5 13.7 14.1 14.2 14.7 15.0 15.1 15.5 15.8 16.0 17.5 18.2 20.2 21.1 21.5 22.2 22.4 23.1 24.5 25.7 28.5 34.6 38.5 43.0 55.6 71.3 77.8 A. Measures of Central Tendency We are to calculate: Mean, Median, Mode The data (already ordered) is: 0.8, 1.4, 1.8, 1.9, 3.2, 3.6, 4.5, 4.5, 4.6, 6.2, 6.5, 7.7, 7.9, 9.9, 10.2, 10.3, 10.9, 11.1, 11.1, 11.6, 11.8, 12.0, 13.1, 13.5, 13.7, 14.1, 14.2, 14.7, 15.0, 15.1, 15.5,…arrow_forwardPEER REPLY 1: Choose a classmate's Main Post. 1. Indicate a range of values for the independent variable (x) that is reasonable based on the data provided. 2. Explain what the predicted range of dependent values should be based on the range of independent values.arrow_forwardIn a company with 80 employees, 60 earn $10.00 per hour and 20 earn $13.00 per hour. Is this average hourly wage considered representative?arrow_forward
arrow_back_ios
SEE MORE QUESTIONS
arrow_forward_ios
Recommended textbooks for you
 Glencoe Algebra 1, Student Edition, 9780079039897...AlgebraISBN:9780079039897Author:CarterPublisher:McGraw Hill
 Big Ideas Math A Bridge To Success Algebra 1: Stu...AlgebraISBN:9781680331141Author:HOUGHTON MIFFLIN HARCOURTPublisher:Houghton Mifflin Harcourt
 Holt Mcdougal Larson Pre-algebra: Student Edition...AlgebraISBN:9780547587776Author:HOLT MCDOUGALPublisher:HOLT MCDOUGAL
Glencoe Algebra 1, Student Edition, 9780079039897...
Algebra
ISBN:9780079039897
Author:Carter
Publisher:McGraw Hill
Big Ideas Math A Bridge To Success Algebra 1: Stu...
Algebra
ISBN:9781680331141
Author:HOUGHTON MIFFLIN HARCOURT
Publisher:Houghton Mifflin Harcourt
Holt Mcdougal Larson Pre-algebra: Student Edition...
Algebra
ISBN:9780547587776
Author:HOLT MCDOUGAL
Publisher:HOLT MCDOUGAL
Hypothesis Testing - Solving Problems With Proportions; Author: The Organic Chemistry Tutor;https://www.youtube.com/watch?v=76VruarGn2Q;License: Standard YouTube License, CC-BY
Hypothesis Testing and Confidence Intervals (FRM Part 1 – Book 2 – Chapter 5); Author: Analystprep;https://www.youtube.com/watch?v=vth3yZIUlGQ;License: Standard YouTube License, CC-BY