
Concept explainers
Videos
Seat Designs. In Exercises 13–20, use the data in the table below for sitting adult males and females (based on anthropometric survey data from Gordon, Churchill, et al.). These data are used often in the design of different seats, including aircraft seats, train seats, theater seats, and classroom seats. (Hint: Draw a graph in each case.)
Sitting Back-to-Knee Length (inches)
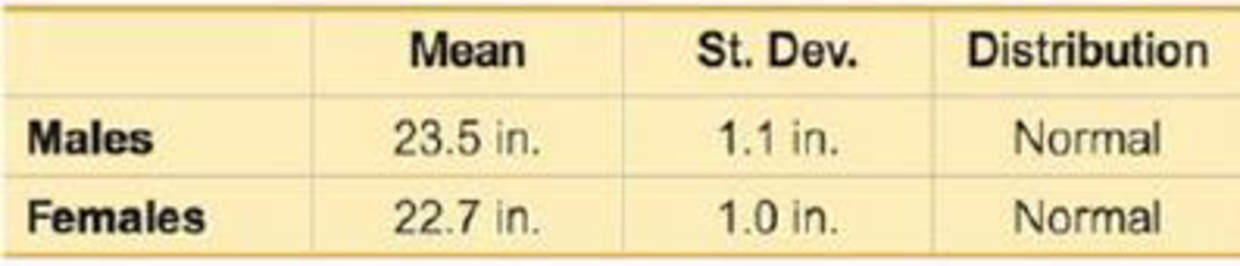
18. For females, find the first quartile Q1, which is the length separating the bottom 25% from the top 75%.

Learn your wayIncludes step-by-step video

Chapter 6 Solutions
Essentials of Statistics (6th Edition)
Additional Math Textbook Solutions
Introductory Statistics (2nd Edition)
Introductory Statistics (10th Edition)
Intro Stats, Books a la Carte Edition (5th Edition)
Elementary Statistics: Picturing the World (6th Edition)
Elementary Statistics: Picturing the World (7th Edition)


- How strongly do physical characteristics of sisters and brothers correlate? The data in the table give the heights (in inches) of 1212 adult pairs. Brother 7171 6868 6666 6767 7070 7171 7070 7373 7272 6565 6666 7070 Sister 6969 6464 6565 6363 6565 6262 6565 6464 6666 5959 6262 6464 To access the data, click the link for your preferred software format. CSV Excel (xls) Excel (xlsx) JMP Mac-Text Minitab14-18 Minitab18+ PC-Text R SPSS TI CrunchIt! © Macmillan Learning Assume Damien is 6767 inches tall. Predict the height of his sister Tonya. Give your answer to one decimal place. Tonya's predicted height:arrow_forwardHow strongly do physical characteristics of sisters and brothers correlate? The data in the table give the heights (in inches) of 1212 adult pairs. Brother 7171 6868 6666 6767 7070 7171 7070 7373 7272 6565 6666 7070 Sister 6969 6464 6565 6363 6565 6262 6565 6464 6666 5959 6262 6464 To access the data, click the link for your preferred software format. CSV Excel (xls) Excel (xlsx) JMP Mac-Text Minitab14-18 Minitab18+ PC-Text R SPSS TI CrunchIt! © Macmillan Learning Use your calculator or software to find the correlation, ?,�, and equation of the least‑squares regression line for predicting sister's height from brother's height, ?̂ .�^. Make a scatterplot of the data and add the regression line to your plot. Give your answer to three decimal places. Enter the equation of the least‑squares regression line, with the numerical values rounded to three decimal places and ?� as the explanatory variable. (If you are using CrunchIt, adjust the…arrow_forwardA comparative Psychologist tests the amount of time it takes for mice to complete a maze as their dependent variable. What type of data would this be? a. ratio b. interval c. ordinal d. nominalarrow_forward
- The data represents the heights of eruptions by a geyser. Height of eruption (in.) 90 62 34 50 Use the heights to construct a stemplot. Identify the two values that are closest to the middle when the data are sorted in order from lowest to highest. 80 50 40 70 50 60 75 57 52 69 62 60 74 70 48 88 Which plot represents a stemplot of the data? O A. OB. C. 3028 4 027 5 000 6 002 7009 8045 9 08 3 4 4002279 50045 6 |008 70028 8 0 9 0 3 4 408 5 00027 6 00229 7 00 45 808 9 0 Identify the two values that are closest to the middle when the data are sorted in order from lowest to highest. The values closest to the middle are inches and inches. (Type whole numbers. Use ascending order.). Click to select your answer(s). 4:14 PM O Type here to search a 17 6/4/2021 hp f3 ins prt sc f5 f6 f8 fg f10 f12 esc IOI dele & back 2. 4 E T. Y 00 L5. %24 3. %23arrow_forwardWhen an anthropologist finds skeletal remains, they need to figure out the height of the person. The height of a person (in cm) and the length of their metacarpal bone (in cm) were collected for 18 sets of skeletal remains. The data are in the table below. X, length of metacarpal (in cm) Y, height (in cm) 51 180 45 173 47 175 42 165 44 171 40 163 42 175 44 173 39 159 45 173 46 175 52 176 50 181 50 178 49 170 46 173 38 157 49 185 a) State the random variables. rv X = of rv Y = of b) Make a scatterplot of X versus Y in StatCrunch (optional). Why do we wish to sketch a scatterplot? c) Find the equation of the best-fitting line (the least squares regression equation). Round values to 2 decimal places. Include the restricted domain. equation: = + * X restricted domain: cm <= X <= cm d) Interpret the slope from part c in the context of this problem. (Pay…arrow_forwardThe following table shows the length, in centimeters, of the humerus and the total wingspan, in centimeters, of several pterosaurs, which are extinct flying reptiles. (A graphing calculator is recommended.) Pterosaur Data Humerus, x Wingspan, y Humerus, x Wingspan, y 27 576 32 589 33 605 35 745 25 559 24 552 23 472 22 461 18 411 17 410 1.5 36 1.4 30 1.3 29 0.9 28 0.8 24 (a) Find the equation of the least-squares regression line for the data. Round constants to the nearest hundredth. ý = 20.06x + 18.26 (b) Use the equation from part (a) to determine, to the nearest centimeter, the projected wingspan of a pterosaur if its humerus is 56 centimeters. 1142 cmarrow_forward
- # i) 2.76: Insect Weights Consider a dataset giving the adult weight of species of insects. Most species of insects weigh less than 5 grams, but there are a few species that weigh a great deal, including the largest insect known: the rare and endangered Giant Weta from New Zealand, which can weigh as much as 71 grams. Describe the shape of the distribution of weights of insects. Is it symmetric or skewed? If it is skewed, is it skewed to the left or skewed to the right? Which will be larger, the mean or the median? # ii) 2.87: (Make up your own data set. Do not give the same answer as in the book!!) # Create a Dataset Give any set of five numbers satisfying the condition that: # a) The mean of the numbers is substantially less than the median. # b) The mean of the numbers is substantially more than the median. # c) The mean and the median are equal.arrow_forwardUse excel and answer all parts pleasearrow_forwardT2.12 The army reports that the distribution of head cir- cumference among male soldiers is approximatelyarrow_forward
 Algebra & Trigonometry with Analytic GeometryAlgebraISBN:9781133382119Author:SwokowskiPublisher:Cengage