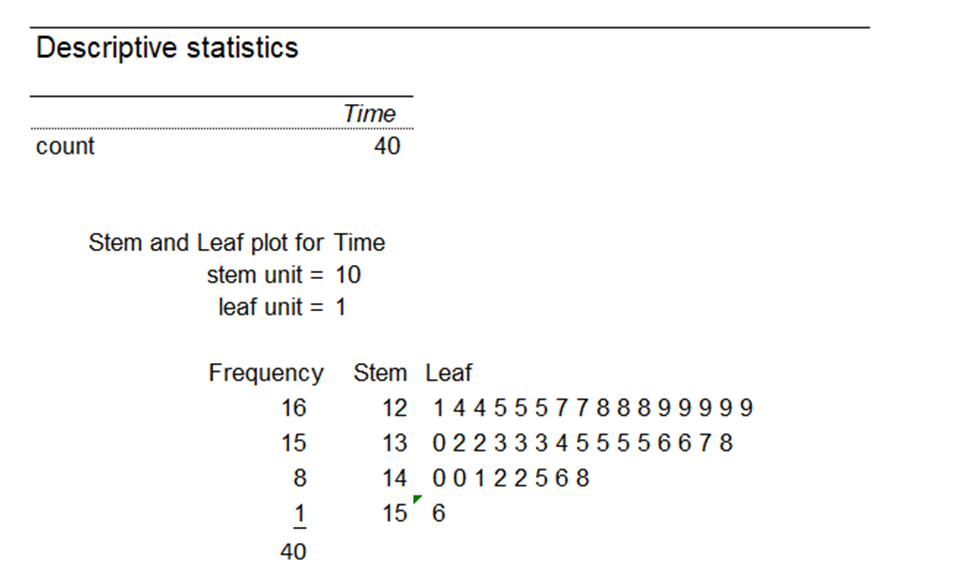
a) Construct a stem-and-leaf plot for the data

MATLAB: An Introduction with Applications
6th Edition
ISBN:9781119256830
Author:Amos Gilat
Publisher:Amos Gilat
Chapter1: Starting With Matlab
Section: Chapter Questions
Problem 1P

Related questions
Question
Use excel and answer all parts please
![### Data Analysis Task
**1. The time to failure in hours of an electronic component subjected to an accelerated life test is provided below:**
- **Data**: 127, 132, 129, 128, 125, 133, 136, 135, 135, 138, 142, 135, 124, 129, 127, 140, 130, 125, 128, 145, 121, 133, 124, 128, 134, 140, 148, 141, 156, 125, 129, 132, 135, 133, 129, 136, 146, 142, 137, 129
**Tasks:**
a) **Construct a stem-and-leaf plot for the data.**
- This involves separating each data value into a "stem" and a "leaf". The "stem" consists of all but the last digit, and the "leaf" is the final digit. Arrange the leaves in ascending order for each stem.
b) **Construct a histogram for the data.**
- A histogram is a graphical representation that organizes a group of data points into user-specified ranges. It shows the frequency of data within specified intervals.
c) **Construct a dotplot for the data.**
- A dotplot is a simple plot consisiting of dots that represent data values. Each dot represents a single count, and dots are stacked vertically when the same value reoccurs.
d) **Construct a boxplot for the data.**
- A boxplot is a standardized way of displaying the dataset based on a five-number summary ("minimum", first quartile [Q1], median, third quartile [Q3], and "maximum"). It can also highlight outliers.
e) **Determine the outliers in the data.**
- Outliers are data points that differ significantly from other observations. This can often be quantitatively determined using the interquartile range (IQR) – values beyond 1.5*IQR above the third quartile and below the first quartile.
---
By completing these tasks, we can gain a comprehensive understanding of the distribution and behavior of the data.](/v2/_next/image?url=https%3A%2F%2Fcontent.bartleby.com%2Fqna-images%2Fquestion%2F84a4babe-df88-4dc0-9444-4ec24957d88f%2F92b44ea1-39e7-4f92-98cb-04e65429b0d4%2F6u8fgu_processed.jpeg&w=3840&q=75)
Transcribed Image Text:### Data Analysis Task
**1. The time to failure in hours of an electronic component subjected to an accelerated life test is provided below:**
- **Data**: 127, 132, 129, 128, 125, 133, 136, 135, 135, 138, 142, 135, 124, 129, 127, 140, 130, 125, 128, 145, 121, 133, 124, 128, 134, 140, 148, 141, 156, 125, 129, 132, 135, 133, 129, 136, 146, 142, 137, 129
**Tasks:**
a) **Construct a stem-and-leaf plot for the data.**
- This involves separating each data value into a "stem" and a "leaf". The "stem" consists of all but the last digit, and the "leaf" is the final digit. Arrange the leaves in ascending order for each stem.
b) **Construct a histogram for the data.**
- A histogram is a graphical representation that organizes a group of data points into user-specified ranges. It shows the frequency of data within specified intervals.
c) **Construct a dotplot for the data.**
- A dotplot is a simple plot consisiting of dots that represent data values. Each dot represents a single count, and dots are stacked vertically when the same value reoccurs.
d) **Construct a boxplot for the data.**
- A boxplot is a standardized way of displaying the dataset based on a five-number summary ("minimum", first quartile [Q1], median, third quartile [Q3], and "maximum"). It can also highlight outliers.
e) **Determine the outliers in the data.**
- Outliers are data points that differ significantly from other observations. This can often be quantitatively determined using the interquartile range (IQR) – values beyond 1.5*IQR above the third quartile and below the first quartile.
---
By completing these tasks, we can gain a comprehensive understanding of the distribution and behavior of the data.
Expert Solution
Step 1
Hey there! Thank you for posting the question. Since your question has more than 3 parts, we are solving the first 3 parts for you, according to our policy. If you need help with any of the other parts, please re-post the question and mention the part you want answered.
(a)
Draw the stem-and-leaf plot by using Excel
Excel add-in (MegaStat) procedure:
Step 1: In EXCEL, Select Add-Ins > MegaStat > Descriptive Statistics.
Step 2: In Input range, select the cell range A1:A41.
Step 3: Check Select Defaults.
Step 4: Choose Stem and Leaf Plot.
Step 5: Click OK.
Excel add-in (PHStat) output:

Step by step
Solved in 3 steps with 4 images

Recommended textbooks for you
MATLAB: An Introduction with Applications
Statistics
ISBN:
9781119256830
Author:
Amos Gilat
Publisher:
John Wiley & Sons Inc

Probability and Statistics for Engineering and th…
Statistics
ISBN:
9781305251809
Author:
Jay L. Devore
Publisher:
Cengage Learning

Statistics for The Behavioral Sciences (MindTap C…
Statistics
ISBN:
9781305504912
Author:
Frederick J Gravetter, Larry B. Wallnau
Publisher:
Cengage Learning
MATLAB: An Introduction with Applications
Statistics
ISBN:
9781119256830
Author:
Amos Gilat
Publisher:
John Wiley & Sons Inc
Probability and Statistics for Engineering and th…
Statistics
ISBN:
9781305251809
Author:
Jay L. Devore
Publisher:
Cengage Learning
Statistics for The Behavioral Sciences (MindTap C…
Statistics
ISBN:
9781305504912
Author:
Frederick J Gravetter, Larry B. Wallnau
Publisher:
Cengage Learning

Elementary Statistics: Picturing the World (7th E…
Statistics
ISBN:
9780134683416
Author:
Ron Larson, Betsy Farber
Publisher:
PEARSON

The Basic Practice of Statistics
Statistics
ISBN:
9781319042578
Author:
David S. Moore, William I. Notz, Michael A. Fligner
Publisher:
W. H. Freeman

Introduction to the Practice of Statistics
Statistics
ISBN:
9781319013387
Author:
David S. Moore, George P. McCabe, Bruce A. Craig
Publisher:
W. H. Freeman