
ELEMENTARY STATISTICS PKG. F13
13th Edition
ISBN: 9781269373333
Author: Triola
Publisher: PEARSON C
expand_more
expand_more
format_list_bulleted
Concept explainers
Videos
Textbook Question
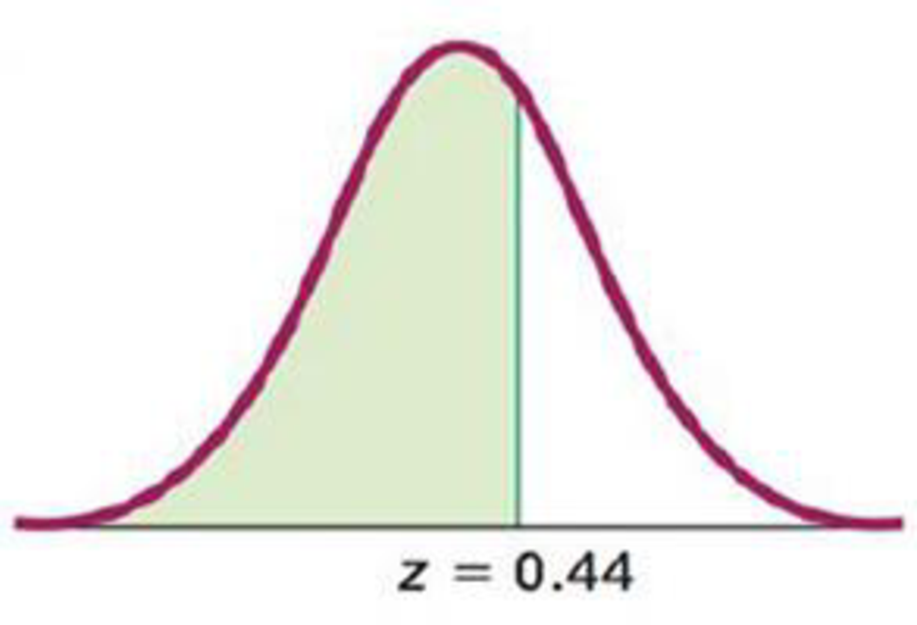
Chapter 6.1, Problem 9BSC
Standard
9.
Expert Solution & Answer

Learn your wayIncludes step-by-step video

schedule06:00
Students have asked these similar questions
A retail chain is interested in determining whether a digital video point-of-purchase (POP) display would stimulate higher sales for a brand advertised compared to the standard cardboard point-of-purchase display. To test this, a one-shot static group design experiment was conducted over a four-week period in 100 different stores. Fifty stores were randomly assigned to the control treatment (standard display) and the other 50 stores were randomly assigned to the experimental treatment (digital display). Compare the sales of the control group (standard POP) to the experimental group (digital POP).
What were the average sales for the standard POP display (control group)?
What were the sales for the digital display (experimental group)?
What is the (mean) difference in sales between the experimental group and control group?
List the null hypothesis being tested.
Do you reject or retain the null hypothesis based on the results of the independent t-test?
Was the difference between the…
What were the average sales for the four weeks prior to the experiment?
What were the sales during the four weeks when the stores used the digital display?
What is the mean difference in sales between the experimental and regular POP time periods?
State the null hypothesis being tested by the paired sample t-test.
Do you reject or retain the null hypothesis?
At a 95% significance level, was the difference significant? Explain why or why not using the results from the paired sample t-test.
Should the manager of the retail chain install new digital displays in each store? Justify your answer.
A retail chain is interested in determining whether a digital video point-of-purchase (POP) display would stimulate higher sales for a brand advertised compared to the standard cardboard point-of-purchase display. To test this, a one-shot static group design experiment was conducted over a four-week period in 100 different stores. Fifty stores were randomly assigned to the control treatment (standard display) and the other 50 stores were randomly assigned to the experimental treatment (digital display). Compare the sales of the control group (standard POP) to the experimental group (digital POP).
What were the average sales for the standard POP display (control group)?
What were the sales for the digital display (experimental group)?
What is the (mean) difference in sales between the experimental group and control group?
List the null hypothesis being tested.
Do you reject or retain the null hypothesis based on the results of the independent t-test?
Was the difference between the…
Chapter 6 Solutions
ELEMENTARY STATISTICS PKG. F13
Ch. 6.1 - Normal Distribution Whats wrong with the following...Ch. 6.1 - Normal Distribution A normal distribution is...Ch. 6.1 - Standard Normal Distribution Identify the two...Ch. 6.1 - Notation What does the notation z indicate?Ch. 6.1 - Continuous Uniform Distribution. In Exercises 58,...Ch. 6.1 - Continuous Uniform Distribution. In Exercises 58,...Ch. 6.1 - Continuous Uniform Distribution. In Exercises 58,...Ch. 6.1 - Continuous Uniform Distribution. In Exercises 58,...Ch. 6.1 - Standard Normal Distribution. In Exercises 912,...Ch. 6.1 - Standard Normal Distribution. In Exercises 912,...
Ch. 6.1 - Standard Normal Distribution. In Exercises 912,...Ch. 6.1 - Standard Normal Distribution. In Exercises 912,...Ch. 6.1 - Standard Normal Distribution. In Exercises 1316,...Ch. 6.1 - Standard Normal Distribution. In Exercises 1316,...Ch. 6.1 - Standard Normal Distribution. In Exercises 1316,...Ch. 6.1 - Standard Normal Distribution. In Exercises 1316,...Ch. 6.1 - Standard Normal Distribution. In Exercises 1736,...Ch. 6.1 - Standard Normal Distribution. In Exercises 1736,...Ch. 6.1 - Standard Normal Distribution. In Exercises 1736,...Ch. 6.1 - Standard Normal Distribution. In Exercises 1736,...Ch. 6.1 - Standard Normal Distribution. In Exercises 1736,...Ch. 6.1 - Standard Normal Distribution. In Exercises 1736,...Ch. 6.1 - Standard Normal Distribution. In Exercises 1736,...Ch. 6.1 - Standard Normal Distribution. In Exercises 1736,...Ch. 6.1 - Standard Normal Distribution. In Exercises 1736,...Ch. 6.1 - Standard Normal Distribution. In Exercises 1736,...Ch. 6.1 - Standard Normal Distribution. In Exercises 1736,...Ch. 6.1 - Standard Normal Distribution. In Exercises 1736,...Ch. 6.1 - Standard Normal Distribution. In Exercises 1736,...Ch. 6.1 - Standard Normal Distribution. In Exercises 1736,...Ch. 6.1 - Standard Normal Distribution. In Exercises 1736,...Ch. 6.1 - Standard Normal Distribution. In Exercises 1736,...Ch. 6.1 - Standard Normal Distribution. In Exercises 1736,...Ch. 6.1 - Standard Normal Distribution. In Exercises 1736,...Ch. 6.1 - Standard Normal Distribution. In Exercises 1736,...Ch. 6.1 - Standard Normal Distribution. In Exercises 1736,...Ch. 6.1 - Finding Bone Density Scores. In Exercises 3740...Ch. 6.1 - Finding Bone Density Scores. In Exercises 3740...Ch. 6.1 - Finding Bone Density Scores. In Exercises 3740...Ch. 6.1 - Finding Bone Density Scores. In Exercises 3740...Ch. 6.1 - Critical Values. In Exercises 4144, find the...Ch. 6.1 - Critical Values. In Exercises 4144, find the...Ch. 6.1 - Critical Values. In Exercises 4144, find the...Ch. 6.1 - Critical Values. In Exercises 4144, find the...Ch. 6.1 - Basis for the Range Rule of Thumb and the...Ch. 6.1 - Basis for the Range Rule of Thumb and the...Ch. 6.1 - Basis for the Range Rule of Thumb and the...Ch. 6.1 - Basis for the Range Rule of Thumb and the...Ch. 6.1 - Significance For bone density scores that are...Ch. 6.1 - Distributions In a continuous uniform...Ch. 6.2 - Birth Weights Based on Data Set 4 Births in...Ch. 6.2 - Birth Weights Based on Data Set 4 Births in...Ch. 6.2 - Normal Distributions What is the difference...Ch. 6.2 - Random Digits Computers are commonly used to...Ch. 6.2 - IQ Scores. In Exercises 58, find the area of the...Ch. 6.2 - IQ Scores. In Exercises 58, find the area of the...Ch. 6.2 - IQ Scores. In Exercises 58, find the area of the...Ch. 6.2 - IQ Scores. In Exercises 58, find the area of the...Ch. 6.2 - IQ Scores. In Exercises 912, find the indicated IQ...Ch. 6.2 - IQ Scores. In Exercises 912, find the indicated IQ...Ch. 6.2 - IQ Scores. In Exercises 912, find the indicated IQ...Ch. 6.2 - IQ Scores. In Exercises 912, find the indicated IQ...Ch. 6.2 - Seat Designs. In Exercises 1320, use the data in...Ch. 6.2 - Seat Designs. In Exercises 1320, use the data in...Ch. 6.2 - Seat Designs. In Exercises 1320, use the data in...Ch. 6.2 - Seat Designs. In Exercises 1320, use the data in...Ch. 6.2 - Seat Designs. In Exercises 1320, use the data in...Ch. 6.2 - Seat Designs. In Exercises 1320, use the data in...Ch. 6.2 - Seat Designs. In Exercises 1320, use the data in...Ch. 6.2 - Seat Designs. In Exercises 1320, use the data in...Ch. 6.2 - In Exercises 2124, use these parameters (based on...Ch. 6.2 - In Exercises 2124, use these parameters (based on...Ch. 6.2 - In Exercises 2124, use these parameters (based on...Ch. 6.2 - In Exercises 2124, use these parameters (based on...Ch. 6.2 - Eye Contact In a study of facial behavior, people...Ch. 6.2 - Designing a Work Station A common design...Ch. 6.2 - Jet Ejection Seats The U.S. Air Force once used...Ch. 6.2 - Quarters After 1964, quarters were manufactured so...Ch. 6.2 - Low Birth Weight The University of Maryland...Ch. 6.2 - Body Temperatures Based on the sample results in...Ch. 6.2 - Durations of Pregnancies The lengths of...Ch. 6.2 - Water Taxi Safety When a water taxi sank in...Ch. 6.2 - Large Data Sets. In Exercises 33 and 34, refer to...Ch. 6.2 - Large Data Sets. In Exercises 33 and 34, refer to...Ch. 6.2 - Curving Test Scores A professor gives a test and...Ch. 6.2 - Outliers For the purposes of constructing modified...Ch. 6.3 - Births There are about 11,000 births each day in...Ch. 6.3 - Sampling with Replacement The Orangetown Medical...Ch. 6.3 - Unbiased Estimators Data Set 4 Births in Appendix...Ch. 6.3 - Sampling Distribution Data Set 4 Births in...Ch. 6.3 - Good Sample? A geneticist is investigating the...Ch. 6.3 - College Presidents There are about 4200 college...Ch. 6.3 - In Exercises 710, use the same population of {4,...Ch. 6.3 - In Exercises 710, use the same population of {4,...Ch. 6.3 - In Exercises 710, use the same population of {4,...Ch. 6.3 - In Exercises 710, use the same population of {4,...Ch. 6.3 - In Exercises 1114, use the population of {34, 36,...Ch. 6.3 - In Exercises 1114, use the population of {34, 36,...Ch. 6.3 - In Exercises 1114, use the population of {34, 36,...Ch. 6.3 - In Exercises 1114, use the population of {34, 36,...Ch. 6.3 - Births: Sampling Distribution of Sample Proportion...Ch. 6.3 - Births: Sampling Distribution of Sample Proportion...Ch. 6.3 - SAT and ACT Tests Because they enable efficient...Ch. 6.3 - Hybridization A hybridization experiment begins...Ch. 6.3 - Using a Formula to Describe a Sampling...Ch. 6.3 - Mean Absolute Deviation Is the mean absolute...Ch. 6.4 - Requirements A researcher collects a simple random...Ch. 6.4 - Small Sample Weights of golden retriever dogs are...Ch. 6.4 - Notation In general, what do the symbols x and x...Ch. 6.4 - Annual Incomes Annual incomes are known to have a...Ch. 6.4 - Using the Central Limit Theorem. In Exercises 58,...Ch. 6.4 - Using the Central Limit Theorem. In Exercises 58,...Ch. 6.4 - Using the Central Limit Theorem. In Exercises 58,...Ch. 6.4 - Using the Central Limit Theorem. In Exercises 58,...Ch. 6.4 - Elevator Safety Example 2 referred to an elevator...Ch. 6.4 - Elevator Safety Exercise 9 uses = 189 lb, which...Ch. 6.4 - Mensa Membership in Mensa requires a score in the...Ch. 6.4 - Designing Manholes According to the website...Ch. 6.4 - Water Taxi Safety Passengers died when a water...Ch. 6.4 - Vending Machines Quarters are now manufactured so...Ch. 6.4 - Southwest Airlines Seats Southwest Airlines...Ch. 6.4 - Coke Cans Assume that cans of Coke are filled so...Ch. 6.4 - Redesign of Ejection Seats When women were finally...Ch. 6.4 - Loading a Tour Boat The Ethan Allen tour boat...Ch. 6.4 - Doorway Height The Boeing 757-200 ER airliner...Ch. 6.4 - Loading Aircraft Before every flight, the pilot...Ch. 6.4 - Correcting for a Finite Population In a study of...Ch. 6.5 - Normal Quantile Plot Data Set 1 Body Data in...Ch. 6.5 - Normal Quantile Plot After constructing a...Ch. 6.5 - Small Sample Data set 29 Coin Weights in Appendix...Ch. 6.5 - Assessing Normality The accompanying histogram is...Ch. 6.5 - Prob. 5BSCCh. 6.5 - Prob. 6BSCCh. 6.5 - Prob. 7BSCCh. 6.5 - Interpreting Normal Quantile Plots. In Exercises...Ch. 6.5 - Prob. 9BSCCh. 6.5 - Determining Normality. In Exercises 912, refer to...Ch. 6.5 - Determining Normality. In Exercises 912, refer to...Ch. 6.5 - Prob. 12BSCCh. 6.5 - Using Technology to Generate Normal Quantile...Ch. 6.5 - Using Technology to Generate Normal Quantile...Ch. 6.5 - Prob. 15BSCCh. 6.5 - Prob. 16BSCCh. 6.5 - Constructing Normal Quantile Plots. In Exercises...Ch. 6.5 - Prob. 18BSCCh. 6.5 - Constructing Normal Quantile Plots. In Exercises...Ch. 6.5 - Constructing Normal Quantile Plots. In Exercises...Ch. 6.5 - Transformations The heights (in inches) of men...Ch. 6.5 - Lognormal Distribution The following are the...Ch. 6.6 - Continuity Correction In testing the assumption...Ch. 6.6 - Checking Requirements Common tests such as the...Ch. 6.6 - Notation Common tests such as the SAT, ACT, LSAT,...Ch. 6.6 - Distribution of Proportions Each week, Nielsen...Ch. 6.6 - Using Normal Approximation. In Exercises 58, do...Ch. 6.6 - Using Normal Approximation. In Exercises 58, do...Ch. 6.6 - Using Normal Approximation. In Exercises 58, do...Ch. 6.6 - Using Normal Approximation. In Exercises 58, do...Ch. 6.6 - Car Colors. In Exercises 912, assume that 100 cars...Ch. 6.6 - Car Colors. In Exercises 912, assume that 100 cars...Ch. 6.6 - Car Colors. In Exercises 912, assume that 100 cars...Ch. 6.6 - Car Colors. In Exercises 912, assume that 100 cars...Ch. 6.6 - Tennis Replay In the year that this exercise was...Ch. 6.6 - Tennis Replay Repeat the preceding exercise after...Ch. 6.6 - Smartphones Based on an LG smartphone survey,...Ch. 6.6 - Eye Color Based on a study by Dr. P. Sorita at...Ch. 6.6 - Mendelian Genetics When Mendel conducted his...Ch. 6.6 - Sleepwalking Assume that 29.2% of people have...Ch. 6.6 - Voters Lying? In a survey of 1002 people, 701 said...Ch. 6.6 - Cell Phones and Brain Cancer In a study of 420,095...Ch. 6.6 - Births The probability of a baby being born a boy...Ch. 6.6 - Overbooking a Boeing 767-300 A Boeing 767-300...Ch. 6 - Bone Density Test. In Exercises 14, assume that...Ch. 6 - Bone Density Test. In Exercises 14, assume that...Ch. 6 - Bone Density Test. In Exercises 14, assume that...Ch. 6 - Bone Density Test. In Exercises 14, assume that...Ch. 6 - Notation a. Identify the values of and for the...Ch. 6 - In Exercises 610, assume that women have diastolic...Ch. 6 - In Exercises 610, assume that women have diastolic...Ch. 6 - In Exercises 610, assume that women have diastolic...Ch. 6 - In Exercises 610, assume that women have diastolic...Ch. 6 - In Exercises 610, assume that women have diastolic...Ch. 6 - Bone Density Test A bone mineral density test is...Ch. 6 - Biometric Security In designing a security system...Ch. 6 - Biometric Security Standing eye heights of men are...Ch. 6 - Sampling Distributions Scores on the Gilliam...Ch. 6 - Unbiased Estimators a. What is an unbiased...Ch. 6 - Disney Monorail The Mark VI monorail used at...Ch. 6 - Disney Monorail Consider the same Mark VI monorail...Ch. 6 - Assessing Normality Listed below are the recent...Ch. 6 - Hybridization Experiment In one of Mendels...Ch. 6 - Tall Clubs The social organization Tall Clubs...Ch. 6 - In Exercises 13, use the following recent annual...Ch. 6 - In Exercises 13, use the following recent annual...Ch. 6 - In Exercises 13, use the following recent annual...Ch. 6 - Blue Eyes Assume that 35% of us have blue eyes...Ch. 6 - Foot Lengths of Women Assume that foot lengths of...Ch. 6 - Assessing Normality It is often necessary to...Ch. 6 - Binomial Probabilities Section 6-6 described a...
Additional Math Textbook Solutions
Find more solutions based on key concepts
CHECK POINT I You deposit $3000 in s savings account at Yourtown Bank, which has rate of 5%. Find the interest ...
Thinking Mathematically (6th Edition)
Repeated linear factors Evaluate the following integrals. 29. 11x(x+3)2dx
Calculus: Early Transcendentals (2nd Edition)
Interpreting a Decision In Exercises 43–48, determine whether the claim represents the null hypothesis or the a...
Elementary Statistics: Picturing the World (7th Edition)
The solution of the given expression
Pre-Algebra Student Edition
The following data were given in a study of a group of 1000 subscribers to a certain magazine: In reference to ...
A First Course in Probability (10th Edition)
Knowledge Booster


Learn more about
Need a deep-dive on the concept behind this application? Look no further. Learn more about this topic, statistics and related others by exploring similar questions and additional content below.Similar questions
- Question 4 An article in Quality Progress (May 2011, pp. 42-48) describes the use of factorial experiments to improve a silver powder production process. This product is used in conductive pastes to manufacture a wide variety of products ranging from silicon wafers to elastic membrane switches. Powder density (g/cm²) and surface area (cm/g) are the two critical characteristics of this product. The experiments involved three factors: reaction temperature, ammonium percentage, stirring rate. Each of these factors had two levels, and the design was replicated twice. The design is shown in Table 3. A222222222222233 Stir Rate (RPM) Ammonium (%) Table 3: Silver Powder Experiment from Exercise 13.23 Temperature (°C) Density Surface Area 100 8 14.68 0.40 100 8 15.18 0.43 30 100 8 15.12 0.42 30 100 17.48 0.41 150 7.54 0.69 150 8 6.66 0.67 30 150 8 12.46 0.52 30 150 8 12.62 0.36 100 40 10.95 0.58 100 40 17.68 0.43 30 100 40 12.65 0.57 30 100 40 15.96 0.54 150 40 8.03 0.68 150 40 8.84 0.75 30 150…arrow_forward- + ++ Table 2: Crack Experiment for Exercise 2 A B C D Treatment Combination (1) Replicate I II 7.037 6.376 14.707 15.219 |++++ 1 བྱ॰༤༠སྦྱོ སྦྱོཋཏྟཱུ a b ab 11.635 12.089 17.273 17.815 с ас 10.403 10.151 4.368 4.098 bc abc 9.360 9.253 13.440 12.923 d 8.561 8.951 ad 16.867 17.052 bd 13.876 13.658 abd 19.824 19.639 cd 11.846 12.337 acd 6.125 5.904 bcd 11.190 10.935 abcd 15.653 15.053 Question 3 Continuation of Exercise 2. One of the variables in the experiment described in Exercise 2, heat treatment method (C), is a categorical variable. Assume that the remaining factors are continuous. (a) Write two regression models for predicting crack length, one for each level of the heat treatment method variable. What differences, if any, do you notice in these two equations? (b) Generate appropriate response surface contour plots for the two regression models in part (a). (c) What set of conditions would you recommend for the factors A, B, and D if you use heat treatment method C = +? (d) Repeat…arrow_forwardQuestion 2 A nickel-titanium alloy is used to make components for jet turbine aircraft engines. Cracking is a potentially serious problem in the final part because it can lead to nonrecoverable failure. A test is run at the parts producer to determine the effect of four factors on cracks. The four factors are: pouring temperature (A), titanium content (B), heat treatment method (C), amount of grain refiner used (D). Two replicates of a 24 design are run, and the length of crack (in mm x10-2) induced in a sample coupon subjected to a standard test is measured. The data are shown in Table 2. 1 (a) Estimate the factor effects. Which factor effects appear to be large? (b) Conduct an analysis of variance. Do any of the factors affect cracking? Use a = 0.05. (c) Write down a regression model that can be used to predict crack length as a function of the significant main effects and interactions you have identified in part (b). (d) Analyze the residuals from this experiment. (e) Is there an…arrow_forward
- A 24-1 design has been used to investigate the effect of four factors on the resistivity of a silicon wafer. The data from this experiment are shown in Table 4. Table 4: Resistivity Experiment for Exercise 5 Run A B с D Resistivity 1 23 2 3 4 5 6 7 8 9 10 11 12 I+I+I+I+Oooo 0 0 ||++TI++o000 33.2 4.6 31.2 9.6 40.6 162.4 39.4 158.6 63.4 62.6 58.7 0 0 60.9 3 (a) Estimate the factor effects. Plot the effect estimates on a normal probability scale. (b) Identify a tentative model for this process. Fit the model and test for curvature. (c) Plot the residuals from the model in part (b) versus the predicted resistivity. Is there any indication on this plot of model inadequacy? (d) Construct a normal probability plot of the residuals. Is there any reason to doubt the validity of the normality assumption?arrow_forwardStem1: 1,4 Stem 2: 2,4,8 Stem3: 2,4 Stem4: 0,1,6,8 Stem5: 0,1,2,3,9 Stem 6: 2,2 What’s the Min,Q1, Med,Q3,Max?arrow_forwardAre the t-statistics here greater than 1.96? What do you conclude? colgPA= 1.39+0.412 hsGPA (.33) (0.094) Find the P valuearrow_forward
- A poll before the elections showed that in a given sample 79% of people vote for candidate C. How many people should be interviewed so that the pollsters can be 99% sure that from 75% to 83% of the population will vote for candidate C? Round your answer to the whole number.arrow_forwardSuppose a random sample of 459 married couples found that 307 had two or more personality preferences in common. In another random sample of 471 married couples, it was found that only 31 had no preferences in common. Let p1 be the population proportion of all married couples who have two or more personality preferences in common. Let p2 be the population proportion of all married couples who have no personality preferences in common. Find a95% confidence interval for . Round your answer to three decimal places.arrow_forwardA history teacher interviewed a random sample of 80 students about their preferences in learning activities outside of school and whether they are considering watching a historical movie at the cinema. 69 answered that they would like to go to the cinema. Let p represent the proportion of students who want to watch a historical movie. Determine the maximal margin of error. Use α = 0.05. Round your answer to three decimal places. arrow_forward
- A random sample of medical files is used to estimate the proportion p of all people who have blood type B. If you have no preliminary estimate for p, how many medical files should you include in a random sample in order to be 99% sure that the point estimate will be within a distance of 0.07 from p? Round your answer to the next higher whole number.arrow_forwardA clinical study is designed to assess the average length of hospital stay of patients who underwent surgery. A preliminary study of a random sample of 70 surgery patients’ records showed that the standard deviation of the lengths of stay of all surgery patients is 7.5 days. How large should a sample to estimate the desired mean to within 1 day at 95% confidence? Round your answer to the whole number.arrow_forwardA clinical study is designed to assess the average length of hospital stay of patients who underwent surgery. A preliminary study of a random sample of 70 surgery patients’ records showed that the standard deviation of the lengths of stay of all surgery patients is 7.5 days. How large should a sample to estimate the desired mean to within 1 day at 95% confidence? Round your answer to the whole number.arrow_forward
arrow_back_ios
SEE MORE QUESTIONS
arrow_forward_ios
Recommended textbooks for you
 Big Ideas Math A Bridge To Success Algebra 1: Stu...AlgebraISBN:9781680331141Author:HOUGHTON MIFFLIN HARCOURTPublisher:Houghton Mifflin Harcourt
Big Ideas Math A Bridge To Success Algebra 1: Stu...
Algebra
ISBN:9781680331141
Author:HOUGHTON MIFFLIN HARCOURT
Publisher:Houghton Mifflin Harcourt
Continuous Probability Distributions - Basic Introduction; Author: The Organic Chemistry Tutor;https://www.youtube.com/watch?v=QxqxdQ_g2uw;License: Standard YouTube License, CC-BY
Probability Density Function (p.d.f.) Finding k (Part 1) | ExamSolutions; Author: ExamSolutions;https://www.youtube.com/watch?v=RsuS2ehsTDM;License: Standard YouTube License, CC-BY
Find the value of k so that the Function is a Probability Density Function; Author: The Math Sorcerer;https://www.youtube.com/watch?v=QqoCZWrVnbA;License: Standard Youtube License