
Concept explainers
Videos
School days: The following table presents the numbers of students enrolled in grades 1 through 8 in public schools in the United States.
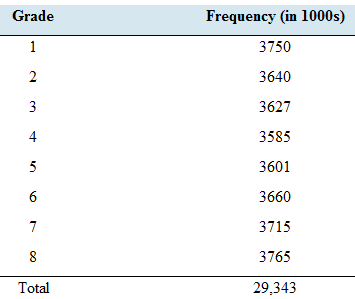
Consider these students to be a population. Let X be the grade of a student randomly chosen from this population.
Construct the
Find the probability that the student is in fourth grade.
Find the probability that the student is seventh or eighth grade.
Compute the
Compute the standard
a.
To construct: The probability distribution of the given random variable.
Explanation of Solution
The enrollment of students from grade
Calculation:
The random variable
To calculate the probability of each value of the random variable, the frequency should be divided by the total number of individuals according to the formula,
As an example,
The all calculation can be expressed in a table as follows. Because both values in the numerator and the denominator is in thousands, in the division those are cancelled out.
The probability distribution can be constructed by the first and third columns of the above table.
b.
To find: The probability to a selected student is from grade four.
Answer to Problem 49E
The probability that the student is in fourth grade is found to be
Explanation of Solution
The probability distribution for the grade of
Calculation:
When a student is fin grade four, the random variable
The relevant probability is calculated in a precious part as,
Conclusion:
The probability of
c.
To find: The probability to a selected student is in grade seven or eight.
Answer to Problem 49E
The probability that the student is seventh or eighth grade is found to be
Explanation of Solution
The probability distribution for the grade of
Calculation:
Same student cannot enroll to two different grades. Hence, being a grade seven student and being a grade eight student are two mutually exclusive events.
Therefore, the probability for this combination can be written as,
By the addition rule, this probability should be equal to
The total probability can be determined as,
Conclusion:
The probability of
d.
To find: The mean of grade of the student.
Answer to Problem 49E
The mean is found to be,
Explanation of Solution
The probability distribution for the grade of
Calculation:
The mean of a random variable, or equivalently the expected value is given by the sum of the product of the values and the corresponding probabilities.
Here, for each value of
Conclusion:
The mean is found to be
e.
To find: The standard deviation of
Answer to Problem 49E
The standard deviation is found to be,
Explanation of Solution
The probability distribution for the grade of
Calculation:
The variance of a random variable
By constructing a table we can do the calculations clearly using the mean of
The sum of right-most column gives the variation of
The standard deviation
Conclusion:
The standard deviation is found to be
Want to see more full solutions like this?
Chapter 6 Solutions
ELEM.STATS>LL<W/CONNECT-FD


- answerarrow_forwardQuestion 2 The data below provides the battery life of thirty eight (38) motorcycle batteries. 100 83 83 105 110 81 114 99 101 105 78 115 74 96 106 89 94 81 106 91 93 86 79 103 94 108 113 100 117 120 77 93 93 85 76 89 78 88 680 a. Test the hypothesis that mean battery life is greater than 90. Use the 1% level of significance. b. Determine if the mean battery life is different from 80. Use the 10% level of significance. Show all steps for the hypothesis test c. Would your conlcusion in part (b) change at the 5% level of significance? | d. Confirm test results in part (b) using JASP. Note: All JASP input files and output tables should be providedarrow_forwardSuppose that 80% of athletes at a certain college graduate. You randomly select eight athletes. What’s the chance that at most 7 of them graduate?arrow_forward
- Suppose that you flip a fair coin four times. What’s the chance of getting at least one head?arrow_forwardSuppose that the chance that an elementary student eats hot lunch is 30 percent. What’s the chance that, among 20 randomly selected students, between 6 and 8 students eat hot lunch (inclusive)?arrow_forwardBob’s commuting times to work are varied. He makes it to work on time 80 percent of the time. On 12 randomly selected trips to work, what’s the chance that Bob makes it on time at least 10 times?arrow_forward
- Your chance of winning a small prize in a scratch-off ticket is 10 percent. You buy five tickets. What’s the chance you will win at least one prize?arrow_forwardSuppose that 60 percent of families own a pet. You randomly sample four families. What is the chance that two or three of them own a pet?arrow_forwardIf 40 percent of university students purchase their textbooks online, in a random sample of five students, what’s the chance that exactly one of them purchased their textbooks online?arrow_forward
- A stoplight is green 40 percent of the time. If you stop at this light eight random times, what is the chance that it’s green exactly five times?arrow_forwardIf 10 percent of the parts made by a certain company are defective and have to be remade, what is the chance that a random sample of four parts has one that is defective?arrow_forwardQuestion 4 Fourteen individuals were given a complex puzzle to complete. The times in seconds was recorded for their first and second attempts and the results provided below: 1 2 3 first attempt 172 255 second attempt 70 4 5 114 248 218 194 270 267 66 6 7 230 219 341 174 8 10 9 210 261 347 218 200 281 199 308 268 243 236 300 11 12 13 14 140 302 a. Calculate a 95% confidence interval for the mean time taken by each individual to complete the (i) first attempt and (ii) second attempt. [la] b. Test the hypothesis that the difference between the two mean times for both is 100 seconds. Use the 5% level of significance. c. Subsequently, it was learnt that the times for the second attempt were incorrecly recorded and that each of the values is 50 seconds too large. What, if any, difference does this make to the results of the test done in part (b)? Show all steps for the hypothesis testarrow_forward
 Glencoe Algebra 1, Student Edition, 9780079039897...AlgebraISBN:9780079039897Author:CarterPublisher:McGraw Hill