
Elementary Statistics: Picturing the World (7th Edition)
7th Edition
ISBN: 9780134683416
Author: Ron Larson, Betsy Farber
Publisher: PEARSON
expand_more
expand_more
format_list_bulleted
Concept explainers
Videos
Textbook Question
Chapter 6.1, Problem 1TY
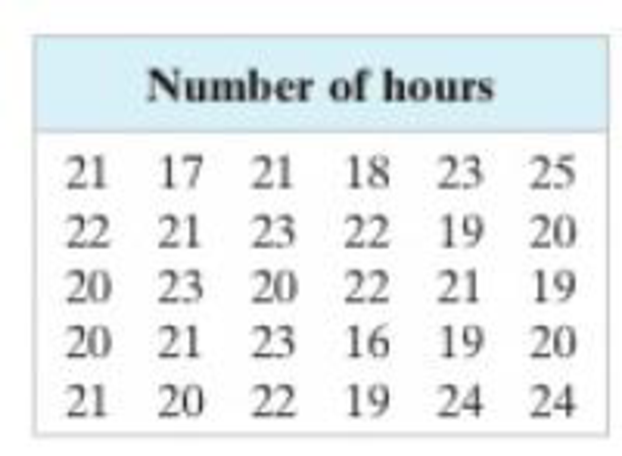
In Example 1, the researcher selects a second random sample of 30 student-athletes and records their numbers of hours spent on required athletic activities (see table at left), Use this sample to find another point estimate of the population
Expert Solution & Answer

Learn your wayIncludes step-by-step video

schedule01:50
Students have asked these similar questions
What is one sample T-test? Give an example of business application of this test?
What is Two-Sample T-Test. Give an example of business application of this test?
.What is paired T-test. Give an example of business application of this test?
What is one way ANOVA test. Give an example of business application of this test?
1. One Sample T-Test: Determine whether the average satisfaction rating of customers for a product is significantly different from a hypothetical mean of 75.
(Hints: The null can be about maintaining status-quo or no difference; If your alternative hypothesis is non-directional (e.g., μ≠75), you should use the two-tailed p-value from excel file to make a decision about rejecting or not rejecting null. If alternative is directional (e.g., μ < 75), you should use the lower-tailed p-value. For alternative hypothesis μ > 75, you should use the upper-tailed p-value.)
H0 =
H1=
Conclusion: The p value from one sample t-test is _______. Since the two-tailed p-value…
Using the accompanying Accounting Professionals data to answer the following questions.
a. Find and interpret a 90% confidence interval for the mean years of service.
b. Find and interpret a 90% confidence interval for the proportion of employees who have a graduate degree.
view the Accounting Professionals data.
Employee Years of Service Graduate Degree?1 26 Y2 8 N3 10 N4 6 N5 23 N6 5 N7 8 Y8 5 N9 26 N10 14 Y11 10 N12 8 Y13 7 Y14 27 N15 16 Y16 17 N17 21 N18 9 Y19 9 N20 9 N
Question content area bottom
Part 1
a. A 90% confidence interval for the mean years of service is
(Use ascending order. Round to two decimal places as needed.)
If, based on a sample size of 900,a political candidate finds that 509people would vote for him in a two-person race, what is the 95%confidence interval for his expected proportion of the vote? Would he be confident of winning based on this poll?
Question content area bottom
Part 1
A
9595%
confidence interval for his expected proportion of the vote is
(Use ascending order. Round to four decimal places as needed.)
Chapter 6 Solutions
Elementary Statistics: Picturing the World (7th Edition)
Ch. 6.1 - In Example 1, the researcher selects a second...Ch. 6.1 - Use the data in Try It Yourself 1 and a 95%...Ch. 6.1 - Use the data in Try It Yourself 1 to construct a...Ch. 6.1 - Use the data in Example 1 and technology to...Ch. 6.1 - Construct a 90% confidence interval for the...Ch. 6.1 - In Example 6, how many student-athletes must the...Ch. 6.1 - When estimating a population mean, are you more...Ch. 6.1 - Which statistic is the best unbiased estimator for...Ch. 6.1 - For the same sample statistics, which level of...Ch. 6.1 - You construct a 95% confidence interval for a...
Ch. 6.1 - In Exercises 58, find the critical value Zc...Ch. 6.1 - In Exercises 58, find the critical value Zc...Ch. 6.1 - In Exercises 58, find the critical value Zc...Ch. 6.1 - In Exercises 58, find the critical value Zc...Ch. 6.1 - Graphical Analysis In Exercises 912, use the...Ch. 6.1 - Graphical Analysis In Exercises 912, use the...Ch. 6.1 - Graphical Analysis In Exercises 912, use the...Ch. 6.1 - Graphical Analysis In Exercises 912, use the...Ch. 6.1 - In Exercises 1316, find the margin of error for...Ch. 6.1 - In Exercises 1316, find the margin of error for...Ch. 6.1 - In Exercises 1316, find the margin of error for...Ch. 6.1 - In Exercises 1316, find the margin of error for...Ch. 6.1 - Matching In Exercises 1720, match the level of...Ch. 6.1 - Matching In Exercises 1720, match the level of...Ch. 6.1 - Matching In Exercises 1720, match the level of...Ch. 6.1 - Matching In Exercises 1720, match the level of...Ch. 6.1 - In Exercises 2124, construct the indicated...Ch. 6.1 - In Exercises 2124, construct the indicated...Ch. 6.1 - In Exercises 2124, construct the indicated...Ch. 6.1 - In Exercises 2124, construct the indicated...Ch. 6.1 - In Exercises 2528, use the confidence interval to...Ch. 6.1 - In Exercises 2528, use the confidence interval to...Ch. 6.1 - In Exercises 2528, use the confidence interval to...Ch. 6.1 - In Exercises 2528, use the confidence interval to...Ch. 6.1 - In Exercises 2932, determine the minimum sample...Ch. 6.1 - In Exercises 2932, determine the minimum sample...Ch. 6.1 - In Exercises 2932, determine the minimum sample...Ch. 6.1 - In Exercises 2932, determine the minimum sample...Ch. 6.1 - Finding the Margin of Error In Exercises 33 and...Ch. 6.1 - Finding the Margin of Error In Exercises 33 and...Ch. 6.1 - Constructing Confidence Intervals In Exercises...Ch. 6.1 - Constructing Confidence Intervals In Exercises...Ch. 6.1 - Constructing Confidence Intervals In Exercises...Ch. 6.1 - Constructing Confidence Intervals In Exercises...Ch. 6.1 - In Exercise 35, does it seem possible that the...Ch. 6.1 - In Exercise 36, does it seem possible that the...Ch. 6.1 - In Exercise 37, does it seem possible that the...Ch. 6.1 - In Exercise 38, does it seem possible that the...Ch. 6.1 - When all other quantities remain the same, how...Ch. 6.1 - Constructing Confidence Intervals In Exercises 45...Ch. 6.1 - Constructing Confidence Intervals In Exercises 45...Ch. 6.1 - Determining a Minimum Sample Size Determine the...Ch. 6.1 - Determining a Minimum Sample Size Determine the...Ch. 6.1 - Cholesterol Contents of Cheese A cheese processing...Ch. 6.1 - Ages of College Students An admissions director...Ch. 6.1 - Paint Can Volumes A paint manufacturer uses a...Ch. 6.1 - Juice Dispensing Machine A beverage company uses a...Ch. 6.1 - Soccer Balls A soccer ball manufacturer wants to...Ch. 6.1 - Tennis Balls A tennis ball manufacturer wants to...Ch. 6.1 - When estimating the population mean, why not...Ch. 6.1 - When all other quantities remain the same, how...Ch. 6.1 - Determine the finite population coection factor...Ch. 6.1 - Use the finite population correction factor to...Ch. 6.1 - Sample Size The equation for determining the...Ch. 6.2 - Find the critical value tc for a 90% confidence...Ch. 6.2 - Construct 90% and 99% confidence intervals for the...Ch. 6.2 - Construct 90% and 95% confidence intervals for the...Ch. 6.2 - You randomly select 18 adult male athletes and...Ch. 6.2 - Finding Critical Values of t In Exercises 14, find...Ch. 6.2 - Finding Critical Values of t In Exercises 14, find...Ch. 6.2 - Finding Critical Values of t In Exercises 14, find...Ch. 6.2 - Finding Critical Values of t In Exercises 14, find...Ch. 6.2 - In Exercises 58, find the margin of error for the...Ch. 6.2 - In Exercises 58, find the margin of error for the...Ch. 6.2 - In Exercises 58, find the margin of error for the...Ch. 6.2 - In Exercises 58, find the margin of error for the...Ch. 6.2 - In Exercises 912, construct the indicated...Ch. 6.2 - In Exercises 912, construct the indicated...Ch. 6.2 - In Exercises 912, construct the indicated...Ch. 6.2 - In Exercises 912, construct the indicated...Ch. 6.2 - In Exercises 1316, use the confidence interval to...Ch. 6.2 - In Exercises 1316, use the confidence interval to...Ch. 6.2 - In Exercises 1316, use the confidence interval to...Ch. 6.2 - In Exercises 1316, use the confidence interval to...Ch. 6.2 - Constructing a Confidence Interval In Exercises...Ch. 6.2 - Constructing a Confidence Interval In Exercises...Ch. 6.2 - Constructing a Confidence Interval In Exercises...Ch. 6.2 - Constructing a Confidence Interval In Exercises...Ch. 6.2 - You research commute times to work and find that...Ch. 6.2 - You research driving distances to work and find...Ch. 6.2 - You research prices of cell phones and find that...Ch. 6.2 - You research repair costs of mobile devices and...Ch. 6.2 - Constructing a Confidence Interval in Exercises...Ch. 6.2 - Constructing a Confidence Interval in Exercises...Ch. 6.2 - Constructing a Confidence Interval in Exercises...Ch. 6.2 - Constructing a Confidence Interval in Exercises...Ch. 6.2 - In Exercise 25, the population mean SAT score is...Ch. 6.2 - In Exercise 28, the population mean weekly time...Ch. 6.2 - Constructing a Confidence Interval Ir. Exercises...Ch. 6.2 - Constructing a Confidence Interval Ir. Exercises...Ch. 6.2 - In Exercise 31, the population mean salary is...Ch. 6.2 - In Exercise 32, the population mean salary is...Ch. 6.2 - Choosing a Distribution In Exercises 3538, use the...Ch. 6.2 - Choosing a Distribution In Exercises 3538, use the...Ch. 6.2 - Choosing a Distribution In Exercises 3538, use the...Ch. 6.2 - Choosing a Distribution In Exercises 3538, use the...Ch. 6.2 - In Exercise 36, does it seem possible that the...Ch. 6.2 - In Exercise 38, does it seem possible that the...Ch. 6.2 - Tennis Ball Manufacturing A company manufactures...Ch. 6.2 - Light Bulb Manufacturing A company manufactures...Ch. 6.2 - Prob. 1ACh. 6.2 - In a random sample of 24 high school students, the...Ch. 6.2 - A marathon is a fool race with a distance of 26.22...Ch. 6.2 - A marathon is a fool race with a distance of 26.22...Ch. 6.2 - A marathon is a fool race with a distance of 26.22...Ch. 6.2 - A marathon is a fool race with a distance of 26.22...Ch. 6.2 - A marathon is a fool race with a distance of 26.22...Ch. 6.2 - A marathon is a fool race with a distance of 26.22...Ch. 6.3 - A poll surveyed 4780 U.S. adults about how often...Ch. 6.3 - Use the data in Try It Yourself 1 to construct a...Ch. 6.3 - Use the data in Example 3 to construct a 99%...Ch. 6.3 - A researcher is estimating the population...Ch. 6.3 - True or False? In Exercises 1 and 2, determine...Ch. 6.3 - True or False? In Exercises 1 and 2, determine...Ch. 6.3 - Finding p and q In Exercises 36, let p be the...Ch. 6.3 - Finding p and q In Exercises 36, let p be the...Ch. 6.3 - Finding p and q In Exercises 36, let p be the...Ch. 6.3 - Finding p and q In Exercises 36, let p be the...Ch. 6.3 - In Exercises 710, use the confidence interval to...Ch. 6.3 - In Exercises 710, use the confidence interval to...Ch. 6.3 - In Exercises 710, use the confidence interval to...Ch. 6.3 - In Exercises 710, use the confidence interval to...Ch. 6.3 - Constructing Confidence Intervals In Exercises 11...Ch. 6.3 - Constructing Confidence Intervals In Exercises 11...Ch. 6.3 - Constructing Confidence Intervals In Exercises 13...Ch. 6.3 - Constructing Confidence Intervals In Exercises 13...Ch. 6.3 - LGBT Identification In a survey of 1,626,773 U.S....Ch. 6.3 - Transgender Bathroom Policy In a survey of 1000...Ch. 6.3 - Congress You wish to estimate, with 95%...Ch. 6.3 - Genetically Modified Organisms You wish to...Ch. 6.3 - Fast Food You wish to estimate, with 90%...Ch. 6.3 - Alcohol-Impaired Driving You wish to estimate,...Ch. 6.3 - In Exercise 11, does it seem possible that the...Ch. 6.3 - In Exercise 14, does it seem possible that the...Ch. 6.3 - In Exercise 17(b), would a sample size of 200 be...Ch. 6.3 - In Exercise 20(b), would a sample size of 600 be...Ch. 6.3 - Constructing Confidence Intervals In Exercises 25...Ch. 6.3 - Constructing Confidence Intervals In Exercises 25...Ch. 6.3 - Constructing Confidence Intervals In Exercises 27...Ch. 6.3 - Constructing Confidence Intervals In Exercises 27...Ch. 6.3 - Translating Statements In Exercises 2934,...Ch. 6.3 - Translating Statements In Exercises 2934,...Ch. 6.3 - Prob. 31ECh. 6.3 - Translating Statements In Exercises 2934,...Ch. 6.3 - Prob. 33ECh. 6.3 - Prob. 34ECh. 6.3 - Prob. 35ECh. 6.3 - Prob. 36ECh. 6.3 - Prob. 37ECh. 6.3 - Prob. 1ACh. 6.3 - Prob. 2ACh. 6.4 - Kind the critical values R2 and I2 for a 90%...Ch. 6.4 - Construct the 90% and 95% confidence intervals for...Ch. 6.4 - Does a population have to be normally distributed...Ch. 6.4 - What happens to the shape of the chi-square...Ch. 6.4 - Prob. 3ECh. 6.4 - Finding Critical Values for X2 In Exercises 38,...Ch. 6.4 - Prob. 5ECh. 6.4 - Finding Critical Values for X2 In Exercises 38,...Ch. 6.4 - Finding Critical Values for X2 In Exercises 38,...Ch. 6.4 - Prob. 8ECh. 6.4 - Prob. 9ECh. 6.4 - Prob. 10ECh. 6.4 - Prob. 11ECh. 6.4 - In Exercises 912, construct the indicated...Ch. 6.4 - Prob. 13ECh. 6.4 - Constructing Confidence Intervals In Exercises...Ch. 6.4 - Constructing Confidence Intervals In Exercises...Ch. 6.4 - Constructing Confidence Intervals In Exercises...Ch. 6.4 - Constructing Confidence Intervals In Exercises...Ch. 6.4 - Constructing Confidence Intervals In Exercises...Ch. 6.4 - Constructing Confidence Intervals In Exercises...Ch. 6.4 - Constructing Confidence Intervals In Exercises...Ch. 6.4 - Constructing Confidence Intervals In Exercises...Ch. 6.4 - Constructing Confidence Intervals In Exercises...Ch. 6.4 - Constructing Confidence Intervals In Exercises...Ch. 6.4 - Constructing Confidence Intervals In Exercises...Ch. 6.4 - Prob. 25ECh. 6.4 - Prob. 26ECh. 6.4 - Prob. 27ECh. 6.4 - Prob. 28ECh. 6.4 - Prob. 29ECh. 6 - The waking times (in minutes past 5:00 A.M.) of 40...Ch. 6 - The driving distances (in miles) to work of 30...Ch. 6 - Prob. 6.1.3RECh. 6 - Prob. 6.1.4RECh. 6 - In Exercises 5 and 6, use the confidence interval...Ch. 6 - Prob. 6.1.6RECh. 6 - Prob. 6.1.7RECh. 6 - Prob. 6.1.8RECh. 6 - In Exercises 912, find the critical value tc for...Ch. 6 - In Exercises 912, find the critical value tc for...Ch. 6 - In Exercises 912, find the critical value tc for...Ch. 6 - Prob. 6.2.12RECh. 6 - Prob. 6.2.13RECh. 6 - Prob. 6.2.14RECh. 6 - Prob. 6.2.15RECh. 6 - Prob. 6.2.16RECh. 6 - Prob. 6.2.17RECh. 6 - Prob. 6.2.18RECh. 6 - In Exercises 19-22, let p be the population...Ch. 6 - Prob. 6.3.20RECh. 6 - In Exercises 19-22, let p be the population...Ch. 6 - Prob. 6.3.22RECh. 6 - In Exercise 19, does it seem possible that the...Ch. 6 - Prob. 6.3.24RECh. 6 - Prob. 6.3.25RECh. 6 - Prob. 6.3.26RECh. 6 - Prob. 6.4.27RECh. 6 - Prob. 6.4.28RECh. 6 - Prob. 6.4.29RECh. 6 - In Exercises 2730, find the critical values R2 and...Ch. 6 - Prob. 6.4.31RECh. 6 - In Exercises 31 and 32, assume the sample is from...Ch. 6 - The winning times (in hours) for a sample of 30...Ch. 6 - The data set represents the amounts of time (in...Ch. 6 - Prob. 4CQCh. 6 - Prob. 5CQCh. 6 - Prob. 6CQCh. 6 - Refer to the data set in Exercise 3. Assume the...Ch. 6 - In a survey of 20% U.S. adults, 1740 think...Ch. 6 - The data set represents the weights (in pounds) of...Ch. 6 - The data set represents the scores of 12 randomly...Ch. 6 - Use the standard normal distribution or the...Ch. 6 - The Safe Drinking Water Act, which was passed in...Ch. 6 - The Safe Drinking Water Act, which was passed in...Ch. 6 - The Safe Drinking Water Act, which was passed in...Ch. 6 - Since 1935, the Gallup Organization has conducted...Ch. 6 - THE GALLUP ORGANIZATION www.gallup.com Since 1935,...Ch. 6 - Since 1935, the Gallup Organization has conducted...Ch. 6 - Since 1935, the Gallup Organization has conducted...
Additional Math Textbook Solutions
Find more solutions based on key concepts
In Exercises 17-20, refer to the accompanying table showing results from a Chembio test for hepatitis C among H...
Elementary Statistics (13th Edition)
Constructing and Graphing Discrete Probability Distributions In Exercises 19 and 20, (a) construct a probabilit...
Elementary Statistics: Picturing the World (7th Edition)
have tocalculate the perimeter of the given figure.
Pre-Algebra Student Edition
In Exercises 17-30, (a) find the function’s domain, (b) find the function’s range, (c) describe the function’s ...
University Calculus: Early Transcendentals (4th Edition)
Fill in each blank so that the resulting statement is true. If n is a counting number, bn, read ______, indicat...
College Algebra (7th Edition)
Knowledge Booster


Learn more about
Need a deep-dive on the concept behind this application? Look no further. Learn more about this topic, statistics and related others by exploring similar questions and additional content below.Similar questions
- Questions An insurance company's cumulative incurred claims for the last 5 accident years are given in the following table: Development Year Accident Year 0 2018 1 2 3 4 245 267 274 289 292 2019 255 276 288 294 2020 265 283 292 2021 263 278 2022 271 It can be assumed that claims are fully run off after 4 years. The premiums received for each year are: Accident Year Premium 2018 306 2019 312 2020 318 2021 326 2022 330 You do not need to make any allowance for inflation. 1. (a) Calculate the reserve at the end of 2022 using the basic chain ladder method. (b) Calculate the reserve at the end of 2022 using the Bornhuetter-Ferguson method. 2. Comment on the differences in the reserves produced by the methods in Part 1.arrow_forwardA population that is uniformly distributed between a=0and b=10 is given in sample sizes 50( ), 100( ), 250( ), and 500( ). Find the sample mean and the sample standard deviations for the given data. Compare your results to the average of means for a sample of size 10, and use the empirical rules to analyze the sampling error. For each sample, also find the standard error of the mean using formula given below. Standard Error of the Mean =sigma/Root Complete the following table with the results from the sampling experiment. (Round to four decimal places as needed.) Sample Size Average of 8 Sample Means Standard Deviation of 8 Sample Means Standard Error 50 100 250 500arrow_forwardA survey of 250250 young professionals found that two dash thirdstwo-thirds of them use their cell phones primarily for e-mail. Can you conclude statistically that the population proportion who use cell phones primarily for e-mail is less than 0.720.72? Use a 95% confidence interval. Question content area bottom Part 1 The 95% confidence interval is left bracket nothing comma nothing right bracket0.60820.6082, 0.72510.7251. As 0.720.72 is within the limits of the confidence interval, we cannot conclude that the population proportion is less than 0.720.72. (Use ascending order. Round to four decimal places as needed.)arrow_forward
- I need help with this problem and an explanation of the solution for the image described below. (Statistics: Engineering Probabilities)arrow_forwardA survey of 250 young professionals found that two-thirds of them use their cell phones primarily for e-mail. Can you conclude statistically that the population proportion who use cell phones primarily for e-mail is less than 0.72? Use a 95% confidence interval. Question content area bottom Part 1 The 95% confidence interval is [ ], [ ] As 0.72 is ▼ above the upper limit within the limits below the lower limit of the confidence interval, we ▼ can cannot conclude that the population proportion is less than 0.72. (Use ascending order. Round to four decimal places as needed.)arrow_forwardI need help with this problem and an explanation of the solution for the image described below. (Statistics: Engineering Probabilities)arrow_forward
- I need help with this problem and an explanation of the solution for the image described below. (Statistics: Engineering Probabilities)arrow_forwardI need help with this problem and an explanation of the solution for the image described below. (Statistics: Engineering Probabilities)arrow_forwardQuestions An insurance company's cumulative incurred claims for the last 5 accident years are given in the following table: Development Year Accident Year 0 2018 1 2 3 4 245 267 274 289 292 2019 255 276 288 294 2020 265 283 292 2021 263 278 2022 271 It can be assumed that claims are fully run off after 4 years. The premiums received for each year are: Accident Year Premium 2018 306 2019 312 2020 318 2021 326 2022 330 You do not need to make any allowance for inflation. 1. (a) Calculate the reserve at the end of 2022 using the basic chain ladder method. (b) Calculate the reserve at the end of 2022 using the Bornhuetter-Ferguson method. 2. Comment on the differences in the reserves produced by the methods in Part 1.arrow_forward
- Questions An insurance company's cumulative incurred claims for the last 5 accident years are given in the following table: Development Year Accident Year 0 2018 1 2 3 4 245 267 274 289 292 2019 255 276 288 294 2020 265 283 292 2021 263 278 2022 271 It can be assumed that claims are fully run off after 4 years. The premiums received for each year are: Accident Year Premium 2018 306 2019 312 2020 318 2021 326 2022 330 You do not need to make any allowance for inflation. 1. (a) Calculate the reserve at the end of 2022 using the basic chain ladder method. (b) Calculate the reserve at the end of 2022 using the Bornhuetter-Ferguson method. 2. Comment on the differences in the reserves produced by the methods in Part 1.arrow_forwardFrom a sample of 26 graduate students, the mean number of months of work experience prior to entering an MBA program was 34.67. The national standard deviation is known to be18 months. What is a 90% confidence interval for the population mean? Question content area bottom Part 1 A 9090% confidence interval for the population mean is left bracket nothing comma nothing right bracketenter your response here,enter your response here. (Use ascending order. Round to two decimal places as needed.)arrow_forwardA test consists of 10 questions made of 5 answers with only one correct answer. To pass the test, a student must answer at least 8 questions correctly. (a) If a student guesses on each question, what is the probability that the student passes the test? (b) Find the mean and standard deviation of the number of correct answers. (c) Is it unusual for a student to pass the test by guessing? Explain.arrow_forward
arrow_back_ios
SEE MORE QUESTIONS
arrow_forward_ios
Recommended textbooks for you
 Glencoe Algebra 1, Student Edition, 9780079039897...AlgebraISBN:9780079039897Author:CarterPublisher:McGraw Hill
 Big Ideas Math A Bridge To Success Algebra 1: Stu...AlgebraISBN:9781680331141Author:HOUGHTON MIFFLIN HARCOURTPublisher:Houghton Mifflin Harcourt
 Holt Mcdougal Larson Pre-algebra: Student Edition...AlgebraISBN:9780547587776Author:HOLT MCDOUGALPublisher:HOLT MCDOUGAL
Glencoe Algebra 1, Student Edition, 9780079039897...
Algebra
ISBN:9780079039897
Author:Carter
Publisher:McGraw Hill
Big Ideas Math A Bridge To Success Algebra 1: Stu...
Algebra
ISBN:9781680331141
Author:HOUGHTON MIFFLIN HARCOURT
Publisher:Houghton Mifflin Harcourt
Holt Mcdougal Larson Pre-algebra: Student Edition...
Algebra
ISBN:9780547587776
Author:HOLT MCDOUGAL
Publisher:HOLT MCDOUGAL
Statistics 4.1 Point Estimators; Author: Dr. Jack L. Jackson II;https://www.youtube.com/watch?v=2MrI0J8XCEE;License: Standard YouTube License, CC-BY
Statistics 101: Point Estimators; Author: Brandon Foltz;https://www.youtube.com/watch?v=4v41z3HwLaM;License: Standard YouTube License, CC-BY
Central limit theorem; Author: 365 Data Science;https://www.youtube.com/watch?v=b5xQmk9veZ4;License: Standard YouTube License, CC-BY
Point Estimate Definition & Example; Author: Prof. Essa;https://www.youtube.com/watch?v=OTVwtvQmSn0;License: Standard Youtube License
Point Estimation; Author: Vamsidhar Ambatipudi;https://www.youtube.com/watch?v=flqhlM2bZWc;License: Standard Youtube License