![WebAssign for Devore's Probability and Statistics for Engineering and the Sciences, 9th Edition [Instant Access], Single-Term](https://s3.amazonaws.com/compass-isbn-assets/textbook_empty_images/large_textbook_empty.svg)
WebAssign for Devore's Probability and Statistics for Engineering and the Sciences, 9th Edition [Instant Access], Single-Term
9th Edition
ISBN: 9780357893104
Author: Devore; Jay L.
Publisher: Cengage Learning US
expand_more
expand_more
format_list_bulleted
Videos
Textbook Question
Chapter 6.1, Problem 1E
The accompanying data on flexural strength (MPa) for concrete beams of a certain type was introduced in Example 1.2.
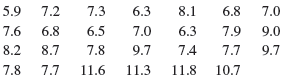
- a. Calculate a point estimate of the
mean value of strength for the conceptual population of all beams manufactured in this fashion, and state which estimator you used. [Hint: Σxi = 219.8.] - b. Calculate a point estimate of the strength value that separates the weakest 50% of all such beams from the strongest 50%, and state which estimator you used.
- c. Calculate and interpret a point estimate of the population standard deviation σ. Which estimator did you use? [Hint:
- d. Calculate a point estimate of the proportion of all such beams whose flexural strength exceeds 10 MPa. [Hint: Think of an observation as a “success” if it exceeds 10.]
- e. Calculate a point estimate of the population coefficient of variation σ/μ, and state which estimator you used.
Expert Solution & Answer

Trending nowThis is a popular solution!

Students have asked these similar questions
Please provide the solution for the attached image in detailed.
20 km, because
GISS
Worksheet 10
Jesse runs a small business selling and delivering mealie meal to the spaza shops.
He charges a fixed rate of R80, 00 for delivery and then R15, 50 for each packet of
mealle meal he delivers. The table below helps him to calculate what to charge
his customers.
10
20
30
40
50
Packets of mealie
meal (m)
Total costs in Rands
80
235
390
545
700
855
(c)
10.1.
Define the following terms:
10.1.1. Independent Variables
10.1.2. Dependent Variables
10.2.
10.3.
10.4.
10.5.
Determine the independent and dependent variables.
Are the variables in this scenario discrete or continuous values? Explain
What shape do you expect the graph to be? Why?
Draw a graph on the graph provided to represent the information in the
table above.
TOTAL COST OF PACKETS OF MEALIE MEAL
900
800
700
600
COST (R)
500
400
300
200
100
0
10
20
30
40
60
NUMBER OF PACKETS OF MEALIE MEAL
Let X be a random variable with support SX = {−3, 0.5, 3, −2.5, 3.5}. Part ofits probability mass function (PMF) is given bypX(−3) = 0.15, pX(−2.5) = 0.3, pX(3) = 0.2, pX(3.5) = 0.15.(a) Find pX(0.5).(b) Find the cumulative distribution function (CDF), FX(x), of X.1(c) Sketch the graph of FX(x).
Chapter 6 Solutions
WebAssign for Devore's Probability and Statistics for Engineering and the Sciences, 9th Edition [Instant Access], Single-Term
Ch. 6.1 - The accompanying data on flexural strength (MPa)...Ch. 6.1 - The National Health and Nutrition Examination...Ch. 6.1 - Consider the following sample of observations on...Ch. 6.1 - The article from which the data in Exercise 1 was...Ch. 6.1 - As an example of a situation in which several...Ch. 6.1 - Urinary angiotensinogen (AGT) level is one...Ch. 6.1 - a. A random sample of 10 houses in a particular...Ch. 6.1 - In a random sample of 80 components of a certain...Ch. 6.1 - Each of 150 newly manufactured items is examined...Ch. 6.1 - Using a long rod that has length , you are going...
Ch. 6.1 - Of n1 randomly selected male smokers, X1 smoked...Ch. 6.1 - Suppose a certain type of fertilizer has an...Ch. 6.1 - Consider a random sample X1,..., Xn from the pdf...Ch. 6.1 - A sample of n captured Pandemonium jet fighters...Ch. 6.1 - Let X1, X2,..., Xn represent a random sample from...Ch. 6.1 - Suppose the true average growth of one type of...Ch. 6.1 - In Chapter 3, we defined a negative binomial rv as...Ch. 6.1 - Let X1, X2,..., Xn be a random sample from a pdf...Ch. 6.1 - An investigator wishes to estimate the proportion...Ch. 6.2 - A diagnostic test for a certain disease is applied...Ch. 6.2 - Let X have a Weibull distribution with parameters ...Ch. 6.2 - Let X denote the proportion of allotted time that...Ch. 6.2 - Let X represent the error in making a measurement...Ch. 6.2 - A vehicle with a particular defect in its emission...Ch. 6.2 - The shear strength of each of ten test spot welds...Ch. 6.2 - Consider randomly selecting n segments of pipe and...Ch. 6.2 - Let X1,..., Xn be a random sample from a gamma...Ch. 6.2 - Prob. 28ECh. 6.2 - Consider a random sample X1, X2,, Xn from the...Ch. 6.2 - At time t = 0, 20 identical components are tested....Ch. 6 - An estimator is said to be consistent if for any ...Ch. 6 - a. Let X1,.., Xn be a random sample from a uniform...Ch. 6 - At time t = 0, there is one individual alive in a...Ch. 6 - The mean squared error of an estimator is MSE ()...Ch. 6 - Prob. 35SECh. 6 - When the population distribution is normal, the...Ch. 6 - When the sample standard deviation S is based on a...Ch. 6 - Each of n specimens is to be weighed twice on the...
Knowledge Booster


Learn more about
Need a deep-dive on the concept behind this application? Look no further. Learn more about this topic, statistics and related others by exploring similar questions and additional content below.Similar questions
- A well-known company predominantly makes flat pack furniture for students. Variability with the automated machinery means the wood components are cut with a standard deviation in length of 0.45 mm. After they are cut the components are measured. If their length is more than 1.2 mm from the required length, the components are rejected. a) Calculate the percentage of components that get rejected. b) In a manufacturing run of 1000 units, how many are expected to be rejected? c) The company wishes to install more accurate equipment in order to reduce the rejection rate by one-half, using the same ±1.2mm rejection criterion. Calculate the maximum acceptable standard deviation of the new process.arrow_forward5. Let X and Y be independent random variables and let the superscripts denote symmetrization (recall Sect. 3.6). Show that (X + Y) X+ys.arrow_forward8. Suppose that the moments of the random variable X are constant, that is, suppose that EX" =c for all n ≥ 1, for some constant c. Find the distribution of X.arrow_forward
- 9. The concentration function of a random variable X is defined as Qx(h) = sup P(x ≤ X ≤x+h), h>0. Show that, if X and Y are independent random variables, then Qx+y (h) min{Qx(h). Qr (h)).arrow_forward10. Prove that, if (t)=1+0(12) as asf->> O is a characteristic function, then p = 1.arrow_forward9. The concentration function of a random variable X is defined as Qx(h) sup P(x ≤x≤x+h), h>0. (b) Is it true that Qx(ah) =aQx (h)?arrow_forward
- 3. Let X1, X2,..., X, be independent, Exp(1)-distributed random variables, and set V₁₁ = max Xk and W₁ = X₁+x+x+ Isk≤narrow_forward7. Consider the function (t)=(1+|t|)e, ER. (a) Prove that is a characteristic function. (b) Prove that the corresponding distribution is absolutely continuous. (c) Prove, departing from itself, that the distribution has finite mean and variance. (d) Prove, without computation, that the mean equals 0. (e) Compute the density.arrow_forward1. Show, by using characteristic, or moment generating functions, that if fx(x) = ½ex, -∞0 < x < ∞, then XY₁ - Y2, where Y₁ and Y2 are independent, exponentially distributed random variables.arrow_forward
- 1. Show, by using characteristic, or moment generating functions, that if 1 fx(x): x) = ½exarrow_forward1990) 02-02 50% mesob berceus +7 What's the probability of getting more than 1 head on 10 flips of a fair coin?arrow_forward9. The concentration function of a random variable X is defined as Qx(h) sup P(x≤x≤x+h), h>0. = x (a) Show that Qx+b(h) = Qx(h).arrow_forward
arrow_back_ios
SEE MORE QUESTIONS
arrow_forward_ios
Recommended textbooks for you
 Glencoe Algebra 1, Student Edition, 9780079039897...AlgebraISBN:9780079039897Author:CarterPublisher:McGraw Hill
 Functions and Change: A Modeling Approach to Coll...AlgebraISBN:9781337111348Author:Bruce Crauder, Benny Evans, Alan NoellPublisher:Cengage Learning
 Linear Algebra: A Modern IntroductionAlgebraISBN:9781285463247Author:David PoolePublisher:Cengage Learning
 College Algebra (MindTap Course List)AlgebraISBN:9781305652231Author:R. David Gustafson, Jeff HughesPublisher:Cengage Learning
 Big Ideas Math A Bridge To Success Algebra 1: Stu...AlgebraISBN:9781680331141Author:HOUGHTON MIFFLIN HARCOURTPublisher:Houghton Mifflin Harcourt
Glencoe Algebra 1, Student Edition, 9780079039897...
Algebra
ISBN:9780079039897
Author:Carter
Publisher:McGraw Hill
Functions and Change: A Modeling Approach to Coll...
Algebra
ISBN:9781337111348
Author:Bruce Crauder, Benny Evans, Alan Noell
Publisher:Cengage Learning
Linear Algebra: A Modern Introduction
Algebra
ISBN:9781285463247
Author:David Poole
Publisher:Cengage Learning
College Algebra (MindTap Course List)
Algebra
ISBN:9781305652231
Author:R. David Gustafson, Jeff Hughes
Publisher:Cengage Learning
Big Ideas Math A Bridge To Success Algebra 1: Stu...
Algebra
ISBN:9781680331141
Author:HOUGHTON MIFFLIN HARCOURT
Publisher:Houghton Mifflin Harcourt
Hypothesis Testing using Confidence Interval Approach; Author: BUM2413 Applied Statistics UMP;https://www.youtube.com/watch?v=Hq1l3e9pLyY;License: Standard YouTube License, CC-BY
Hypothesis Testing - Difference of Two Means - Student's -Distribution & Normal Distribution; Author: The Organic Chemistry Tutor;https://www.youtube.com/watch?v=UcZwyzwWU7o;License: Standard Youtube License