
Concept explainers
Videos
Uniform Distribution: Measurement Errors Measurement errors from instruments are often modeled using the uniform distribution (see Problem 16). To determine the
- (a) less than +0.03 microsecond (i.e., −0.05 ≤ x < 0.03)?
- (b) more than −0.02 microsecond?
- (c) between −0.04 and +0.01 microsecond?
- (d) Find the
mean and standard deviation of measurement errors. Measurements from an instrument are called unbiased if the mean of the measurement errors is zero. Would you say the measurements for these acoustical sensors are unbiased? Explain.
16. Expand Your Knowledge: Continuous Uniform Probability Distribution Let α and β be any two constants such that α < β. Suppose we choose a point x at random in the interval from α to β. In this context the phrase at random is taken to mean that the point x is as likely to be chosen from one particular part of the interval as any other part. Consider the rectangle.
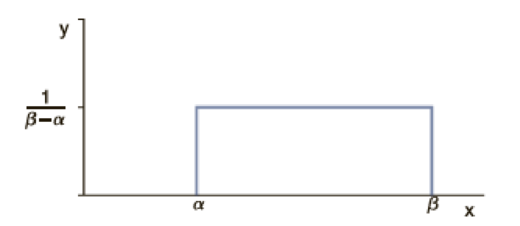
The base of the rectangle has length β − α and the height of the rectangle is 1/(β − α), so the area of the rectangle is 1. As such, this rectangle’s top can be thought of as part of a probability density curve. Since we specify that x must lie between α and β, the probability of a point occurring outside the interval [α, β] is, by definition, 0. From a geometric point of view, x chosen at random from α to β means we are equally likely to land anywhere in the interval from α to β. For this reason, the top of the (rectangle’s) density curve is flat or uniform.
Now suppose that a and b are numbers such that α ≤ a < b ≤ β. What is the probability that a number x chosen at random from α to β will fall in the interval [a, b]? Consider the graph
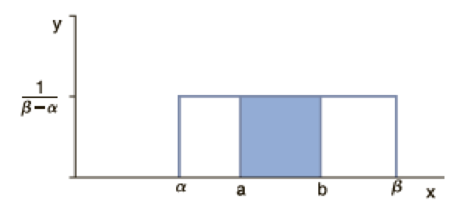
Because x is chosen at random from [α, β], the area of the rectangle that lies above [a, b] is the probability that x lies in [a, b]. This area is
In this way we can assign a probability to any interval inside [α, β]. This probability distribution is called the continuous uniform distribution (also called the rectangular distribution). Using some extra mathematics, it can be shown that if x is a random variable with this distribution, then the mean and standard deviation of x are
Sedimentation experiments are very important in the study of biology, medicine, hydrodynamics, petroleum engineering, civil engineering, and so on. The size (diameter) of approximately spherical particles is important since larger particles hinder and sometimes block the movement of smaller particles. Usually the size of sediment particles follows a uniform distribution (Reference: Y. Zimmels, “Theory of Kindred Sedimentation of Polydisperse Mixtures,” AIChE Journal, Vol. 29, No. 4, pp. 669–676).
Suppose a veterinary science experiment injects very small, spherical pellets of low-level radiation directly into an animal’s bloodstream. The purpose is to attempt to cure a form of recurring cancer. The pellets eventually dissolve and pass through the animal’s system. Diameters of the pellets are uniformly distributed from 0.015 mm to 0.065 mm. If a pellet enters an artery, what is the probability that it will be the following sizes?
- (a) 0.050 mm or larger. Hint: All particles are between 0.015 mm and 0.065 mm, so larger than 0.050 means 0.050 ≤ x ≤ 0.065.
- (b) 0.040 mm or smaller
- (c) between 0.035 mm and 0.055 mm
- (d) Compute the mean size of the particles.
- (e) Compute the standard deviation of particle size.
Want to see the full answer?
Check out a sample textbook solution
Chapter 6 Solutions
UNDERSTANDABLE STAT. >PRINT UPGRADE<


- Binomial Prob. Question: A new teaching method claims to improve student engagement. A survey reveals that 60% of students find this method engaging. If 15 students are randomly selected, what is the probability that: a) Exactly 9 students find the method engaging?b) At least 7 students find the method engaging? (2 points = 1 x 2 answers) Provide answers in the yellow cellsarrow_forwardIn a survey of 2273 adults, 739 say they believe in UFOS. Construct a 95% confidence interval for the population proportion of adults who believe in UFOs. A 95% confidence interval for the population proportion is ( ☐, ☐ ). (Round to three decimal places as needed.)arrow_forwardFind the minimum sample size n needed to estimate μ for the given values of c, σ, and E. C=0.98, σ 6.7, and E = 2 Assume that a preliminary sample has at least 30 members. n = (Round up to the nearest whole number.)arrow_forward
- In a survey of 2193 adults in a recent year, 1233 say they have made a New Year's resolution. Construct 90% and 95% confidence intervals for the population proportion. Interpret the results and compare the widths of the confidence intervals. The 90% confidence interval for the population proportion p is (Round to three decimal places as needed.) J.D) .arrow_forwardLet p be the population proportion for the following condition. Find the point estimates for p and q. In a survey of 1143 adults from country A, 317 said that they were not confident that the food they eat in country A is safe. The point estimate for p, p, is (Round to three decimal places as needed.) ...arrow_forward(c) Because logistic regression predicts probabilities of outcomes, observations used to build a logistic regression model need not be independent. A. false: all observations must be independent B. true C. false: only observations with the same outcome need to be independent I ANSWERED: A. false: all observations must be independent. (This was marked wrong but I have no idea why. Isn't this a basic assumption of logistic regression)arrow_forward
- Business discussarrow_forwardSpam filters are built on principles similar to those used in logistic regression. We fit a probability that each message is spam or not spam. We have several variables for each email. Here are a few: to_multiple=1 if there are multiple recipients, winner=1 if the word 'winner' appears in the subject line, format=1 if the email is poorly formatted, re_subj=1 if "re" appears in the subject line. A logistic model was fit to a dataset with the following output: Estimate SE Z Pr(>|Z|) (Intercept) -0.8161 0.086 -9.4895 0 to_multiple -2.5651 0.3052 -8.4047 0 winner 1.5801 0.3156 5.0067 0 format -0.1528 0.1136 -1.3451 0.1786 re_subj -2.8401 0.363 -7.824 0 (a) Write down the model using the coefficients from the model fit.log_odds(spam) = -0.8161 + -2.5651 + to_multiple + 1.5801 winner + -0.1528 format + -2.8401 re_subj(b) Suppose we have an observation where to_multiple=0, winner=1, format=0, and re_subj=0. What is the predicted probability that this message is spam?…arrow_forwardConsider an event X comprised of three outcomes whose probabilities are 9/18, 1/18,and 6/18. Compute the probability of the complement of the event. Question content area bottom Part 1 A.1/2 B.2/18 C.16/18 D.16/3arrow_forward
- John and Mike were offered mints. What is the probability that at least John or Mike would respond favorably? (Hint: Use the classical definition.) Question content area bottom Part 1 A.1/2 B.3/4 C.1/8 D.3/8arrow_forwardThe details of the clock sales at a supermarket for the past 6 weeks are shown in the table below. The time series appears to be relatively stable, without trend, seasonal, or cyclical effects. The simple moving average value of k is set at 2. What is the simple moving average root mean square error? Round to two decimal places. Week Units sold 1 88 2 44 3 54 4 65 5 72 6 85 Question content area bottom Part 1 A. 207.13 B. 20.12 C. 14.39 D. 0.21arrow_forwardThe details of the clock sales at a supermarket for the past 6 weeks are shown in the table below. The time series appears to be relatively stable, without trend, seasonal, or cyclical effects. The simple moving average value of k is set at 2. If the smoothing constant is assumed to be 0.7, and setting F1 and F2=A1, what is the exponential smoothing sales forecast for week 7? Round to the nearest whole number. Week Units sold 1 88 2 44 3 54 4 65 5 72 6 85 Question content area bottom Part 1 A. 80 clocks B. 60 clocks C. 70 clocks D. 50 clocksarrow_forward
 Mathematics For Machine TechnologyAdvanced MathISBN:9781337798310Author:Peterson, John.Publisher:Cengage Learning,