
Concept explainers
Videos
Fishing: Trout The following data are based on information taken from Daily Creel Summary, published by the Paiute Indian Nation. Pyramid Lake. Nevada. Movie stars and U.S. presidents have fished Pyramid Lake. It is one of the best places in the lower 48 states to catch trophy cutthroat trout. In this table, x = number of fish caught in a 6-hour period. The percentage data are the percentages of fishermen who catch x fish in a 6-hour period while fishing from shore.
| X | 0 | 1 | 2 | 3 | 4 or more |
| % | 44% | 36% | 15% | 4% | 1% |
(a) Convert the percentages to probabilities and make a histogram of the
(b) Find the probability that a fisherman selected at random fishing from shore catches one or more fish in a 6-hour period.
(c) Find the probability that a fisherman selected at random fishing from shore catches two or more fish in a 6-hour period.
(d) Compute
(c) Compute
(a)
The provided percentage in terms of probability and histogram.
Answer to Problem 13P
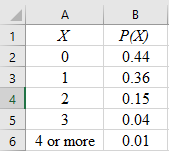
Solution: The table that shows the percentage in terms of probability is shown below:
| x | 0 | 1 | 2 | 3 | 4 or more |
| P(x) | 0.44 | 0.36 | 0.15 | 0.04 | 0.01 |
Explanation of Solution
Given: The following table is given as:
| x | 0 | 1 | 2 | 3 | 4 or more |
| Percentage | 44% | 36% | 15% | 4% | 1% |
Calculation: The percentage can be converted into probability by dividing the percentage by 100.
For
Similarly, the probabilities for the values of
| x | 0 | 1 | 2 | 3 | 4 or more |
| P(x) | 0.44 | 0.36 | 0.15 | 0.04 | 0.01 |
To graph the data, follow the steps given below in MS Excel:
Step 1: Enter the data into an MS Excel sheet. The screenshot is given below:
Step 2: Select the data and click on ‘Insert’. Go to ‘charts’ and select the ‘Clustered Column’ option as the chart type.

Step 3: Select the first plot and click the ‘add chart element’ option that is provided in the left-hand corner of the menu bar. Insert the ‘Chart title’. The histogram for the provided data is shown below.
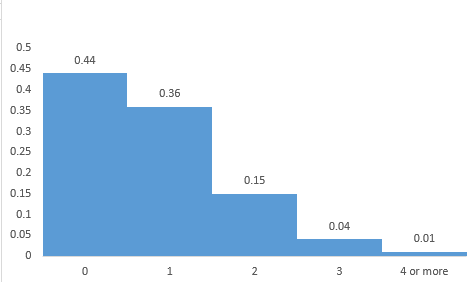
Interpretation: It can be seen that the histogram has a long right tail. So, it is skewed to the right.
(b)
The probability that a fisherman who selected fishes at random from the shore, catches one or more fish in a 6-hour period.
Answer to Problem 13P
Solution: The probability is 0.56.
Explanation of Solution
Given: The probability distribution table is given below:
| x | 0 | 1 | 2 | 3 | 4 or more |
| P(x) | 0.44 | 0.36 | 0.15 | 0.04 | 0.01 |
Calculation: The probability that a fisherman who selected fishes at random from the shore, catches one or more fish in a 6-hour period can be obtained by:
According to the probability distribution table, the value of the probability
Interpretation: There is a 56% chance of selecting the fishes at random from the shore, catches one or more fish in a 6-hour period.
(c)
The probability that a fisherman who selected fishes from the shore, catches two or more fish in a 6-hour period.
Answer to Problem 13P
Solution: The probability is 0.20.
Explanation of Solution
Given: The probability distribution table is given below:
| x | 0 | 1 | 2 | 3 | 4 or more |
| P(x) | 0.44 | 0.36 | 0.15 | 0.04 | 0.01 |
Calculation: The probability that that a fisherman who selected fishes at random from the shore catches two or more fish in a 6-hour period can be obtained by:
According to the probability distribution table, the probabilities-
Interpretation: There is a 20% chance of selecting the fishes at random from the shore, catches two or more fish in a 6-hour period.
(d)
The expected value ‘
Answer to Problem 13P
Solution: The expected value ‘
Explanation of Solution
Given: The probability distribution table is given below:
| x | 0 | 1 | 2 | 3 | 4 or more |
| P(x) | 0.44 | 0.36 | 0.15 | 0.04 | 0.01 |
Calculation: The formula to calculate the expected value is:
Here,
Hence, the expected value is 0.82.
(e)
The standard deviation ‘
Answer to Problem 13P
Solution: The standard deviation ‘
Explanation of Solution
Given: The probability distribution table is given below:
| x | 0 | 1 | 2 | 3 | 4 or more |
| P(x) | 0.44 | 0.36 | 0.15 | 0.04 | 0.01 |
Calculation: The formula to calculate the standard deviation is:
Here,
Hence, the standard deviation is 0.899.
Want to see more full solutions like this?
Chapter 6 Solutions
UNDERSTANDING BASIC STAT LL BUND >A< F


- F Make a box plot from the five-number summary: 100, 105, 120, 135, 140. harrow_forward14 Is the standard deviation affected by skewed data? If so, how? foldarrow_forwardFrequency 15 Suppose that your friend believes his gambling partner plays with a loaded die (not fair). He shows you a graph of the outcomes of the games played with this die (see the following figure). Based on this graph, do you agree with this person? Why or why not? 65 Single Die Outcomes: Graph 1 60 55 50 45 40 1 2 3 4 Outcome 55 6arrow_forward
- lie y H 16 The first month's telephone bills for new customers of a certain phone company are shown in the following figure. The histogram showing the bills is misleading, however. Explain why, and suggest a solution. Frequency 140 120 100 80 60 40 20 0 0 20 40 60 80 Telephone Bill ($) 100 120arrow_forward25 ptical rule applies because t Does the empirical rule apply to the data set shown in the following figure? Explain. 2 6 5 Frequency 3 сл 2 1 0 2 4 6 8 00arrow_forward24 Line graphs typically connect the dots that represent the data values over time. If the time increments between the dots are large, explain why the line graph can be somewhat misleading.arrow_forward
- 17 Make a box plot from the five-number summary: 3, 4, 7, 16, 17. 992) waarrow_forward12 10 - 8 6 4 29 0 Interpret the shape, center and spread of the following box plot. brill smo slob.nl bagharrow_forwardSuppose that a driver's test has a mean score of 7 (out of 10 points) and standard deviation 0.5. a. Explain why you can reasonably assume that the data set of the test scores is mound-shaped. b. For the drivers taking this particular test, where should 68 percent of them score? c. Where should 95 percent of them score? d. Where should 99.7 percent of them score? Sarrow_forward
- 13 Can the mean of a data set be higher than most of the values in the set? If so, how? Can the median of a set be higher than most of the values? If so, how? srit to estaarrow_forwardA random variable X takes values 0 and 1 with probabilities q and p, respectively, with q+p=1. find the moment generating function of X and show that all the moments about the origin equal p. (Note- Please include as much detailed solution/steps in the solution to understand, Thank you!)arrow_forward1 (Expected Shortfall) Suppose the price of an asset Pt follows a normal random walk, i.e., Pt = Po+r₁ + ... + rt with r₁, r2,... being IID N(μ, o²). Po+r1+. ⚫ Suppose the VaR of rt is VaRq(rt) at level q, find the VaR of the price in T days, i.e., VaRq(Pt – Pt–T). - • If ESq(rt) = A, find ES₁(Pt – Pt–T).arrow_forward
 Glencoe Algebra 1, Student Edition, 9780079039897...AlgebraISBN:9780079039897Author:CarterPublisher:McGraw Hill
 Holt Mcdougal Larson Pre-algebra: Student Edition...AlgebraISBN:9780547587776Author:HOLT MCDOUGALPublisher:HOLT MCDOUGAL
 Big Ideas Math A Bridge To Success Algebra 1: Stu...AlgebraISBN:9781680331141Author:HOUGHTON MIFFLIN HARCOURTPublisher:Houghton Mifflin Harcourt
 Functions and Change: A Modeling Approach to Coll...AlgebraISBN:9781337111348Author:Bruce Crauder, Benny Evans, Alan NoellPublisher:Cengage Learning