FUNCTIONS+CHANGE -WEBASSIGN
6th Edition
ISBN: 9780357422496
Author: Crauder
Publisher: CENGAGE L
expand_more
expand_more
format_list_bulleted
Textbook Question
Chapter 6.1, Problem 10E
Reminder Round all answers to two decimal places unless otherwise indicated.
Car Trips with Given Graphs
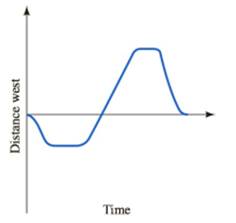
a. The graph in Figure 6.24 shows your distance west of home on a car trip. Make a graph of velocity.
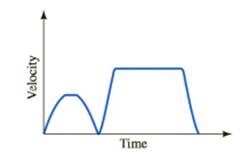
b. The graph in Figure 6.25 shows your velocity on a different car trip. Assuming that you start at home, make a graph of your distance west of home.

FIGURE 6.24 A graph of distance west of home

FIGURE 6.25 A graph of velocity for a different car trip
Expert Solution & Answer
Want to see the full answer?
Check out a sample textbook solution
Students have asked these similar questions
Directions: Use the equation A = Pet to answer each question and be sure to show all your work.
1. If $5,000 is deposited in an account that receives 6.1% interest compounded continuously, how much money is in the
account after 6 years?
2. After how many years will an account have $12,000 if $6,000 is deposited, and the account receives 3.8% interest
compounded continuously?
3. Abigail wants to save $15,000 to buy a car in 7 years. If she deposits $10,000 into an account that receives 5.7% interest
compounded continuously, will she have enough money in 7 years?
4. Daniel deposits $8,000 into a continuously compounding interest account. After 18 years, there is $13,006.40 in the account.
What was the interest rate?
5. An account has $26,000 after 15 years. The account received 2.3% interest compounded continuously. How much was
deposited initially?
TRIANGLES
INDEPENDENT PRACTICE
ription Criangle write and cow
Using each picture or description of triangle write and solve an equation in ordering the
number of degrees in each angle
TRIANGLE
EQUATION & WORK
ANGLE MEASURES
A
B
-(7x-2)°
(4x)
(3x)°
(5x − 10)
C
(5x – 2)
(18x)
E
3.
G
4.
H
(16x)°
LL
2A=
2B=
ZE=
Answer ASAP and every part, please. Structures.
Chapter 6 Solutions
FUNCTIONS+CHANGE -WEBASSIGN
Ch. 6.1 - ReminderRound all answers to two decimal places...Ch. 6.1 - Reminder Round all answers to two decimal places...Ch. 6.1 - Reminder Round all answers to two decimal places...Ch. 6.1 - Reminder Round all answers to two decimal places...Ch. 6.1 - Reminder Round all answers to two decimal places...Ch. 6.1 - Reminder Round all answers to two decimal places...Ch. 6.1 - Reminder Round all answers to two decimal places...Ch. 6.1 - Reminder Round all answers to two decimal places...Ch. 6.1 - Reminder Round all answers to two decimal places...Ch. 6.1 - Reminder Round all answers to two decimal places...
Ch. 6.1 - Prob. 11ECh. 6.1 - Prob. 12ECh. 6.1 - Velocity What is the rate of change in directed...Ch. 6.1 - Sign of VelocityWhen directed distance is...Ch. 6.1 - Sign of VelocityWhen the graph of directed...Ch. 6.1 - Constant VelocityWhen velocity is constant, what...Ch. 6.1 - Constant Velocity When the graph of directed...Ch. 6.1 - Prob. 6SBECh. 6.1 - Prob. 7SBECh. 6.1 - Prob. 8SBECh. 6.1 - Prob. 9SBECh. 6.1 - Prob. 10SBECh. 6.1 - Change in Direction A graph of directed distance...Ch. 6.1 - Prob. 12SBECh. 6.2 - Prob. 1ECh. 6.2 - Reminder Round all answers to two decimal places...Ch. 6.2 - Reminder Round all answers to decimal places...Ch. 6.2 - Reminder Round all answers to decimal places...Ch. 6.2 - Reminder Round all answers to decimal places...Ch. 6.2 - Reminder Round all answers to decimal places...Ch. 6.2 - Reminder Round all answers to decimal places...Ch. 6.2 - Prob. 8ECh. 6.2 - Reminder Round all answers to decimal places...Ch. 6.2 - Prob. 10ECh. 6.2 - Prob. 11ECh. 6.2 - ReminderRound all answers to two decimal places...Ch. 6.2 - Reminder Round all answers to two decimal places...Ch. 6.2 - ReminderRound all answers to two decimal places...Ch. 6.2 - Prob. 15ECh. 6.2 - Prob. 16ECh. 6.2 - Prob. 17ECh. 6.2 - Prob. 18ECh. 6.2 - SKILL BUILDING EXERCISES Marginal Cost: Let C(n)...Ch. 6.2 - SKILL BUILDING EXERCISES Marginal Profit: Your...Ch. 6.2 - SKILL BUILDING EXERCISES Buying for the Short...Ch. 6.2 - SKILL BUILDING EXERCISES Buying a company: You are...Ch. 6.2 - Meaning Of Rate Change: What is the common term...Ch. 6.2 - A Mathematical Term: If f=f(x), then we use dfdx...Ch. 6.2 - Sign of the Derivative: Suppose f=f(x). What is...Ch. 6.2 - Prob. 8SBECh. 6.2 - Prob. 9SBECh. 6.2 - Prob. 10SBECh. 6.2 - Prob. 11SBECh. 6.2 - Prob. 12SBECh. 6.2 - Prob. 13SBECh. 6.2 - Prob. 14SBECh. 6.2 - Prob. 15SBECh. 6.2 - Prob. 16SBECh. 6.3 - ReminderRound all answers to two decimal places...Ch. 6.3 - ReminderRound all answers to two decimal places...Ch. 6.3 - Reminder Round all answers to two decimal places...Ch. 6.3 - Reminder Round all answers to two decimal places...Ch. 6.3 - ReminderRound all answers to two decimal places...Ch. 6.3 - ReminderRound all answers to two decimal places...Ch. 6.3 - ReminderRound all answers to two decimal places...Ch. 6.3 - Prob. 8ECh. 6.3 - Prob. 9ECh. 6.3 - Prob. 10ECh. 6.3 - ReminderRound all answers to two decimal places...Ch. 6.3 - Prob. 12ECh. 6.3 - Rate of Change for a Linear Function If f is the...Ch. 6.3 - Rate of Change for a Linear Function If f is the...Ch. 6.3 - Rate of Change from Data Suppose f=f(x) satisfies...Ch. 6.3 - Rate of Change from Data Suppose f=f(x) satisfies...Ch. 6.3 - Prob. 5SBECh. 6.3 - Prob. 6SBECh. 6.3 - Estimating Rates of Change By direct calculation,...Ch. 6.3 - Estimating Rates of Change with the CalculatorMake...Ch. 6.3 - Prob. 9SBECh. 6.3 - Prob. 10SBECh. 6.3 - Prob. 11SBECh. 6.3 - Prob. 12SBECh. 6.3 - Prob. 13SBECh. 6.3 - Prob. 14SBECh. 6.4 - ReminderRound all answers to two decimal places...Ch. 6.4 - Reminder Round all answers to two decimal places...Ch. 6.4 - Reminder Round all answers to two decimal places...Ch. 6.4 - Prob. 4ECh. 6.4 - Prob. 5ECh. 6.4 - Prob. 6ECh. 6.4 - Prob. 7ECh. 6.4 - Prob. 8ECh. 6.4 - Prob. 9ECh. 6.4 - Prob. 10ECh. 6.4 - Prob. 11ECh. 6.4 - Prob. 12ECh. 6.4 - Prob. 13ECh. 6.4 - Prob. 14ECh. 6.4 - Prob. 1SBECh. 6.4 - Prob. 2SBECh. 6.4 - Prob. 3SBECh. 6.4 - New Equation of Change? The tax liability T in...Ch. 6.4 - Prob. 5SBECh. 6.4 - Prob. 6SBECh. 6.4 - Prob. 7SBECh. 6.4 - Prob. 8SBECh. 6.4 - Prob. 9SBECh. 6.4 - Prob. 10SBECh. 6.4 - A Leaky BalloonA balloon leaks air changes volume...Ch. 6.4 - Prob. 12SBECh. 6.4 - Solving an Equation of Change Solve the equation...Ch. 6.4 - Prob. 14SBECh. 6.4 - Filling a Tank The water level in a tank rises...Ch. 6.4 - Solving an Equation of Change Solve the equation...Ch. 6.5 - Reminder Round all answers to two decimal places...Ch. 6.5 - Prob. 2ECh. 6.5 - Prob. 3ECh. 6.5 - Prob. 4ECh. 6.5 - Prob. 5ECh. 6.5 - Prob. 6ECh. 6.5 - Prob. 7ECh. 6.5 - Prob. 8ECh. 6.5 - Prob. 9ECh. 6.5 - Prob. 10ECh. 6.5 - Prob. 11ECh. 6.5 - Prob. 12ECh. 6.5 - Prob. 13ECh. 6.5 - Prob. 1SBECh. 6.5 - Prob. 2SBECh. 6.5 - Prob. 3SBECh. 6.5 - Prob. 4SBECh. 6.5 - Prob. 5SBECh. 6.5 - Prob. 6SBECh. 6.5 - WaterWater flows into a tank, and a certain part...Ch. 6.5 - Prob. 8SBECh. 6.5 - Prob. 9SBECh. 6.5 - Prob. 10SBECh. 6.5 - Prob. 11SBECh. 6.5 - Prob. 12SBECh. 6.5 - Equation of ChangeFor the equation of change...Ch. 6.5 - Prob. 14SBECh. 6.CR - Prob. 1CRCh. 6.CR - Prob. 2CRCh. 6.CR - Prob. 3CRCh. 6.CR - Prob. 4CRCh. 6.CR - Prob. 5CRCh. 6.CR - Prob. 6CRCh. 6.CR - Prob. 7CRCh. 6.CR - Prob. 8CRCh. 6.CR - Prob. 9CRCh. 6.CR - Prob. 10CRCh. 6.CR - Prob. 11CRCh. 6.CR - Prob. 12CRCh. 6.CR - Prob. 13CRCh. 6.CR - Prob. 14CRCh. 6.CR - Prob. 15CRCh. 6.CR - Prob. 16CRCh. 6.CR - Prob. 17CRCh. 6.CR - Prob. 18CRCh. 6.CR - Reminder Round all answers to two decimal places...Ch. 6.CR - Prob. 20CR
Knowledge Booster
Learn more about
Need a deep-dive on the concept behind this application? Look no further. Learn more about this topic, algebra and related others by exploring similar questions and additional content below.Similar questions
- I want to learn this topic l dont know anything about itarrow_forwardSolve the linear system of equations attached using Gaussian elimination (not Gauss-Jordan) and back subsitution. Remember that: A matrix is in row echelon form if Any row that consists only of zeros is at the bottom of the matrix. The first non-zero entry in each other row is 1. This entry is called aleading 1. The leading 1 of each row, after the first row, lies to the right of the leading 1 of the previous row.arrow_forwardPRIMERA EVALUACIÓN SUMATIVA 10. Determina la medida de los ángulos in- teriores coloreados en cada poligono. ⚫ Octágono regular A 11. Calcula es número de lados qu poligono regular, si la medida quiera de sus ángulos internos • a=156° A= (-2x+80 2 156 180- 360 0 = 24-360 360=24° • a = 162° 1620-180-360 6=18-360 360=19 2=360= 18 12. Calcula las medida ternos del cuadrilá B X+5 x+10 A X+X+ Sx+6 5x=3 x=30 0 лаб • Cuadrilátero 120° 110° • α = 166° 40' 200=180-360 0 = 26-360 360=20 ひ=360 20 18 J 60° ⚫a=169° 42' 51.43" 169.4143180-340 0 = 10.29 54-360 360 10.2857 2=360 10.2857 @Saarrow_forward
- Please help I'm a working mom trying to help my son last minute (6th grader)! Need help with the blank ones and check the ones he got with full calculation so we can use it to study! Especially the mixed number fractions cause I'm rusty. Thanks in advance!arrow_forward|| 38 5층-11- 6 4 7 2 6arrow_forwardMs.sally has 12 studentsMr Franklin has twice as many students as Ms. Sally.how many students does Mr Franklin have?arrow_forward
- explainwhat is means for a shape to be symmetricarrow_forwarde Grade Breakdown x Dashboard | Big Spring HX Dashboard | Big Spring H x Home | Lesson | Assessm cds.caolacourses.edisonlearning.com/lessons/assessmentplayer Co bigspringsd.org bookmarks Prodigy New Tab my video Brielynn... Algebra 2 Part 1-Exam-EDCP.MA003.A D Question 6 D ? 10 17°F Mostly sunny BSMS Home Significant Events in... Classes 25 26 27 28 29 30 31 32 33 34 35 36 37 38 39 40 Solve using row operations: x-3y= -4; 2x - y = 7 Use the paperclip button below to attach files. Student can enter max 2000 characters BISU DAIAAA X2 X2 T ② Type here Q Search e I ✓ Paragra Oarrow_forward1+3+5+7+ …+300 using gauss’s problemarrow_forward
arrow_back_ios
SEE MORE QUESTIONS
arrow_forward_ios
Recommended textbooks for you
 Functions and Change: A Modeling Approach to Coll...AlgebraISBN:9781337111348Author:Bruce Crauder, Benny Evans, Alan NoellPublisher:Cengage LearningAlgebra & Trigonometry with Analytic GeometryAlgebraISBN:9781133382119Author:SwokowskiPublisher:Cengage
 Intermediate AlgebraAlgebraISBN:9781285195728Author:Jerome E. Kaufmann, Karen L. SchwittersPublisher:Cengage Learning
 Trigonometry (MindTap Course List)TrigonometryISBN:9781305652224Author:Charles P. McKeague, Mark D. TurnerPublisher:Cengage Learning
 Glencoe Algebra 1, Student Edition, 9780079039897...AlgebraISBN:9780079039897Author:CarterPublisher:McGraw Hill

Functions and Change: A Modeling Approach to Coll...
Algebra
ISBN:9781337111348
Author:Bruce Crauder, Benny Evans, Alan Noell
Publisher:Cengage Learning

Algebra & Trigonometry with Analytic Geometry
Algebra
ISBN:9781133382119
Author:Swokowski
Publisher:Cengage

Intermediate Algebra
Algebra
ISBN:9781285195728
Author:Jerome E. Kaufmann, Karen L. Schwitters
Publisher:Cengage Learning

Trigonometry (MindTap Course List)
Trigonometry
ISBN:9781305652224
Author:Charles P. McKeague, Mark D. Turner
Publisher:Cengage Learning

Glencoe Algebra 1, Student Edition, 9780079039897...
Algebra
ISBN:9780079039897
Author:Carter
Publisher:McGraw Hill

Graph Theory: Euler Paths and Euler Circuits; Author: Mathispower4u;https://www.youtube.com/watch?v=5M-m62qTR-s;License: Standard YouTube License, CC-BY
WALK,TRIAL,CIRCUIT,PATH,CYCLE IN GRAPH THEORY; Author: DIVVELA SRINIVASA RAO;https://www.youtube.com/watch?v=iYVltZtnAik;License: Standard YouTube License, CC-BY