
Videos
Core Skill: Modeling The goal of this modeling challenge is to draw a graph showing a different relationship between ecosystem function and species richness, one based on the rivet hypothesis, which was proposed in 1981.
Modeling Challenge: In 1981, Paul and Ann Ehrlich proposed a relationship between ecosystem function and species richness called the rivet hypothesis. In this model, species are like the rivets on an airplane. Some species play a small but critical role in keeping the plane, the ecosystem, airborne, while other species do not, and we cannot tell beforehand which species affect the ecosystem function the most. The loss of a single rivet will probably not weaken the plane. However, the loss of few rivets would impair airworthiness. The plane could still function but not at maximum efficiency. Continuing on, the loss of a few more rivets could again be tolerated, but the loss of yet more rivets would prove critical to the airplane’s function. Thus, ecosystem function declines with decreased species richness in a stepwise fashion. Draw a graph that depicts a model for the rivet hypothesis. Use the same format as those in Figure 60.2.
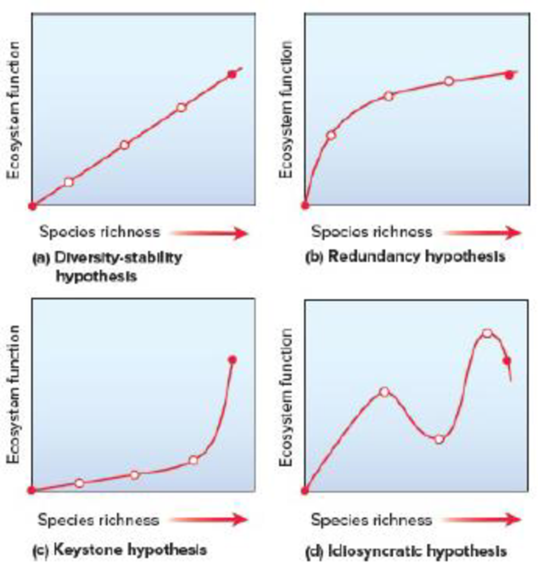
Figure 60.2 Graphical representations of possible relationships between ecosystem function and species richness. The two solid dots represent the end points of a continuum of species richness. The first dot is at the origin, where there are no species and no community services. The second dot represents a natural level of species richness. The relationship is strongest in (a) and weakest in (d).
Want to see the full answer?
Check out a sample textbook solution
Chapter 60 Solutions
BROOKER BIO 3-HOLE PUNCH W/CONNECT BUND

