
Concept explainers
Videos
A shop works a 400-minute day. The manager of the shop wants an output of 200 units per day for the assembly line that has the elemental tasks shown in the table. Do the following:
a. Construct the precedence diagram.
b. Assign tasks according to the most following tasks rule. Break ties with the greatest positional weight rule.
c. Assign tasks according to the greatest positional weight rule. Break ties with the most following tasks rule.
d. Compute the balance delay for each rule. Which one yields the better set of assignments in this instance?
a)
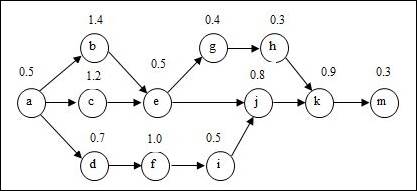
To draw: The precedence diagram.
Introduction:
Process selection:
It is the tactical choices made by a firm in picking the kind of production procedure to be followed in the process of production. The process is selected after reviewing many numbers of criteria and constraints.
Answer to Problem 8P
Precedence diagram:
Explanation of Solution
Given information:
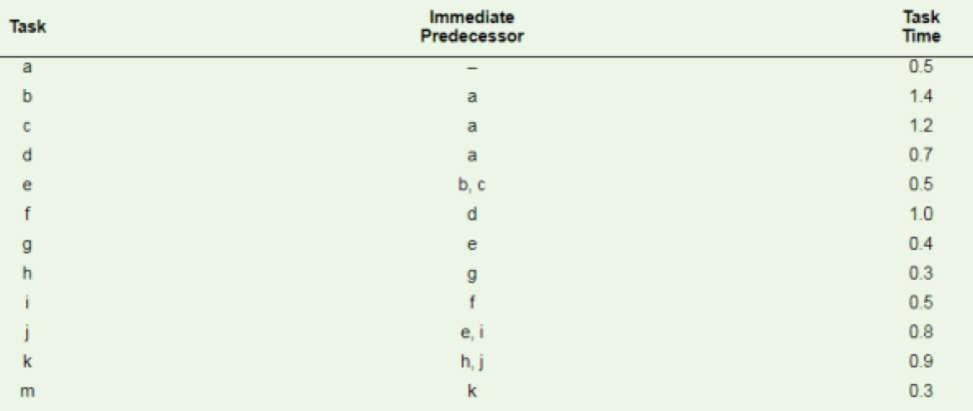
| Task | Task time (Minutes) | Immediate predecessor |
| a | 0.5 | Nil |
| b | 1.4 | a |
| c | 1.2 | a |
| d | 0.7 | a |
| e | 0.5 | b, c |
| f | 1 | d |
| g | 0.4 | e |
| h | 0.3 | g |
| i | 0.5 | f |
| j | 0.8 | e, i |
| k | 0.9 | h, j |
| m | 0.3 | k |
Number of minutes per day = 400
Desired output per day = 200 units
Precedence diagram:
The precedence diagram is drawn circles and arrows. The tasks are represented in circles and weights for each task are represented outside the circle. The arrows are represented to show which task is preceding the other task and so on.
b)
To assign: Tasks on the basis of most following tasks.
Introduction:
Process selection:
It is the tactical choices made by a firm in picking the kind of production procedure to be followed in the process of production. The process is selected after reviewing many numbers of criteria and constraints.
Explanation of Solution
Given information:
| Task | Task time (Minutes) | Immediate predecessor |
| a | 0.5 | Nil |
| b | 1.4 | a |
| c | 1.2 | a |
| d | 0.7 | a |
| e | 0.5 | b, c |
| f | 1 | d |
| g | 0.4 | e |
| h | 0.3 | g |
| i | 0.5 | f |
| j | 0.8 | e, i |
| k | 0.9 | h, j |
| m | 0.3 | k |
Number of minutes per day = 400
Desired output per day = 200 units
Calculation of cycle time:
The cycle time is calculated by dividing the operating time per day by the desired output per day.
The number of following tasks, calculation of positional weight for each task is shown below.
| Task | Following tasks | Number of following tasks | Calculation of positional weight | Positional weight |
| a | b, c, d, e, f, g, h, i, j, k, m | 11 | 0.5 + 1.4 + 1.2 + 0.7 + 0.5 + 1 + 0.4 + 0.3 + 0.5 + 0.8 + 0.9 + 0.3 | 8.5 |
| b | e, g, h, j, k, m | 6 | 1.4 + 0.5 + 0.4 + 0.3 + 0.8 + 0.9 + 0.3 | 4.6 |
| c | e, g, h, j, k, m | 6 | 1.2 + 0.5 + 0.4 + 0.3 + 0.8 + 0.9 + 0.3 | 4.4 |
| d | f, i, j, k, m | 5 | 0.7 + 1 + 0.5 + 0.8 + 0.9 + 0.3 | 4.2 |
| e | g, h, j, k, m | 5 | 0.5 + 0.4 + 0.3 + 0.8+ 0.9 + 0.3 | 3.2 |
| f | i, j, k, m | 4 | 1 + 0.5 + 0.8 + 0.9 + 0.3 | 3.5 |
| g | h, k, m | 3 | 0.4 + 0.3 + 0.9 + 0.3 | 1.9 |
| h | k, m | 2 | 0.3 + 0.9 + 0.3 | 1.5 |
| i | j, k, m | 3 | 0.5 + 0.8 0.9 + 0.3 | 2.5 |
| j | k, m | 2 | 0.8 + 0.9 + 0.3 | 2 |
| k | m | 1 | 0.9 + 0.3 | 1.2 |
| m | Nil | 0 | 0.3 | 0.3 |
Assigning tasks to workstations:
| Workstation number | Eligible task | Assigned task | Task time | Unassigned cycle time | Reason |
| 2 | |||||
| 1 | a | a | 0.5 | 1.5 | Task 'a' is the only eligible task available |
| b, c, d | b | 1.4 | 0.1 | Task 'b' has the highest positional weight | |
| c, d | None | 0.1 (Idle time) | The task time is greater than the unassigned cycle time. | ||
| 2 | |||||
| 2 | c, d | c | 1.2 | 0.8 | Task 'c' has more following tasks |
| d, e | d | 0.7 | 0.1 | Task 'd' has the highest positional weight | |
| e, f | None | 0.1 (Idle time) | The task time is greater than the unassigned cycle time. | ||
| 2 | |||||
| 3 | e, f | e | 0.5 | 1.5 | Task 'e' has more following tasks |
| f, g | f | 1 | 0.5 | Task 'f' has more following tasks | |
| g, i | i | 0.5 | 0 | Task 'i' has the highest positional weight | |
| 2 | |||||
| 4 | g, j | g | 0.4 | 1.6 | Task 'g' has more following tasks |
| h, j | j | 0.8 | 0.8 | Task 'j' has the highest positional weight | |
| h | h | 0.3 | 0.5 | Task 'h' is the only eligible task available | |
| k | None | 0.5 (Idle time) | The task time is greater than the unassigned cycle time. | ||
| 2 | |||||
| 5 | k | k | 0.9 | 1.1 | Task 'k' is the only eligible task available |
| m | m | 0.3 | 0.8 | Task 'm' is the only task remaining | |
| 0.8 (Idle time) | All tasks completed |
Overview of tasks assignment:
| Workstation | Assigned tasks | Total cycle time used | Idle time |
| 1 | a, b | 1.9 | 0.1 |
| 2 | c, d | 1.9 | 0.1 |
| 3 | e, f, i | 2 | 0 |
| 4 | g, j, h | 1.5 | 0.5 |
| 5 | k, m | 1.2 | 0.8 |
c)
To assign: Tasks on the basis of greatest positional weight.
Introduction:
Process selection:
It is the tactical choices made by a firm in picking the kind of production procedure to be followed in the process of production. The process is selected after reviewing many numbers of criteria and constraints.
Explanation of Solution
Given information:
| Task | Task time (Minutes) | Immediate predecessor |
| a | 0.5 | Nil |
| b | 1.4 | a |
| c | 1.2 | a |
| d | 0.7 | a |
| e | 0.5 | b, c |
| f | 1 | d |
| g | 0.4 | e |
| h | 0.3 | g |
| i | 0.5 | f |
| j | 0.8 | e, i |
| k | 0.9 | h, j |
| m | 0.3 | k |
Number of minutes per day = 400
Desired output per day = 200 units
Calculation of cycle time:
The cycle time is calculated by dividing the operating time per day by the desired output per day.
The number of following tasks, calculation of positional weight for each task is shown below.
| Task | Following tasks | Number of following tasks | Calculation of positional weight | Positional weight |
| a | b, c, d, e, f, g, h, i, j, k, m | 11 | 0.5 + 1.4 + 1.2 + 0.7 + 0.5 + 1 + 0.4 + 0.3 + 0.5 + 0.8 + 0.9 + 0.3 | 8.5 |
| b | e, g, h, j, k, m | 6 | 1.4 + 0.5 + 0.4 + 0.3 + 0.8 + 0.9 + 0.3 | 4.6 |
| c | e, g, h, j, k, m | 6 | 1.2 + 0.5 + 0.4 + 0.3 + 0.8 + 0.9 + 0.3 | 4.4 |
| d | f, i, j, k, m | 5 | 0.7 + 1 + 0.5 + 0.8 + 0.9 + 0.3 | 4.2 |
| e | g, h, j, k, m | 5 | 0.5 + 0.4 + 0.3 + 0.8+ 0.9 + 0.3 | 3.2 |
| f | i, j, k, m | 4 | 1 + 0.5 + 0.8 + 0.9 + 0.3 | 3.5 |
| g | h, k, m | 3 | 0.4 + 0.3 + 0.9 + 0.3 | 1.9 |
| h | k, m | 2 | 0.3 + 0.9 + 0.3 | 1.5 |
| i | j, k, m | 3 | 0.5 + 0.8 0.9 + 0.3 | 2.5 |
| j | k, m | 2 | 0.8 + 0.9 + 0.3 | 2 |
| k | m | 1 | 0.9 + 0.3 | 1.2 |
| m | Nil | 0 | 0.3 | 0.3 |
Assigning tasks to workstations:
| Workstation number | Eligible task | Assigned task | Task time | Unassigned cycle time | Reason |
| 2 | |||||
| 1 | a | a | 0.5 | 1.5 | Task 'a' is the only eligible task available |
| b, c, d | b | 1.4 | 0.1 | Task 'b' has the highest positional weight | |
| c, d | None | 0.1 (Idle time) | The task time is greater than the unassigned cycle time. | ||
| 2 | |||||
| 2 | c, d | c | 1.2 | 0.8 | Task 'c' has the highest positional weight |
| d, e | d | 0.7 | 0.1 | Task 'd' has the highest positional weight | |
| e, f | None | 0.1 (Idle time) | The task time is greater than the unassigned cycle time. | ||
| 2 | |||||
| 3 | e, f | f | 1 | 1 | Task 'f' has the highest positional weight |
| e, i | e | 0.5 | 0.5 | Task 'e' has the highest positional weight | |
| g, i | i | 0.5 | 0 | Task 'g' has the highest positional weight | |
| 2 | |||||
| 4 | g, j | j | 0.8 | 1.2 | Task 'j' has the highest positional weight |
| g | g | 0.4 | 0.8 | Task 'g' is the only eligible task available | |
| h | h | 0.3 | 0.5 | Task 'h' is the only eligible task available | |
| k | None | 0.5 (Idle time) | The task time is greater than the unassigned cycle time. | ||
| 2 | |||||
| 5 | k | k | 0.9 | 1.1 | Task 'k' is the only eligible task available |
| m | m | 0.3 | 0.8 | Task 'm' is the only task remaining | |
| 0.8 (Idle time) | All tasks completed |
Overview of tasks assignment:
| Workstation | Assigned tasks | Total cycle time used | Idle time |
| 1 | a, b | 1.9 | 0.1 |
| 2 | c, d | 1.9 | 0.1 |
| 3 | f, e, i | 2 | 0 |
| 4 | j, g, h | 1.5 | 0.5 |
| 5 | k, m | 1.2 | 0.8 |
d)
To determine: The balance delay.
Introduction:
Process selection:
It is the tactical choices made by a firm in picking the kind of production procedure to be followed in the process of production. The process is selected after reviewing many numbers of criteria and constraints.
Answer to Problem 8P
Explanation of Solution
The balance delay is also known as the percentage of idle time.
Formula to calculate percentage of idle time:
Calculation of percentage of idle time:
Most following tasks:
The percentage of idle time is 15%.
Greatest positional weight:
The percentage of idle time is 15%.
The balance delay for most following tasks and greatest positional weight rule is 15%.
Want to see more full solutions like this?
Chapter 6 Solutions
OPERATIONS MANAGEMENT(LL)-W/CONNECT


- PepsiCo South Africa says the incident where a woman discovered part of a rodent in her loaf of bread, is anisolated occurrence.Durban woman, Nombulelo Mkumla, took to social media last week to share how she discovered the rodent.In a lengthy Facebook post, she said she purchased the loaf of bread from a local shop after work on August 27.For the next days, Mkumla proceeded to use slices of bread from the load to make toast."Then, on the morning of August 31, I took the bread out of the fridge to make toast and noticed something disgusting andscary. I took a picture and sent it to my friends, and one of them said, 'Yi mpuku leyo tshomi' [That's a rat friend]“."I was in denial and suggested it might be something else, but the rat scenario made sense - it's possible the rat got into thebread at the factory, and no one noticed," Mkumla said.She went back to the shop she'd bought the bread from and was told to lay a complaint directly with the supplier.She sent an email with a video and…arrow_forwardThe deaths are included in the discharges; this includes deaths occurring in less than 48 hours and postoperative deaths. Rehabilitation had 362 discharges, 22 deaths, 1<48 hours, 0 Postoperative. what is the gross death rate for the rehabilitation service?arrow_forwardA copy machine is available 24 hours a day. On a typical day, the machine produces 100 jobs. Each job takes about 3 minutes on the machine, 2 minutes of which is processing time and 1 minute is setup time (logging in, defining the job). About 20 percent of the jobs need to be reworked, in which case the setup time and the processing time have to be repeated. The remainder of the time, the equipment is idle. What is the OEE of the equipment?arrow_forward
- How do you think we can keep updating Toyota's ideas as new technologies come out and what customers want keeps changing?arrow_forwardGiven how TPS has helped change things in so many fields, do you think there are parts of it that might be hard to use in areas that aren’t about making things, like in healthcare or services? If so, why do you think that might be?arrow_forwardDo you feel there is anything positive about rework?arrow_forward
- Do you think technology can achieve faster setup times? How would it be implemented in the hospital workforce?arrow_forwardIn your experience or opinion, do you think process changes like organizing workspaces make a bigger difference, or is investing in technology usually the better solution for faster setups?arrow_forwardHave you seen rework done in your business, and what was done to prevent that from occurring again?arrow_forward
- Research a company different than case studies examined and search the internet and find an example of a business that had to rework a process. How was the organization affected to rework a process in order to restore a good flow unit? Did rework hurt a process or improve the organization's operational efficiency? • Note: Include a reference with supportive citations in the discussion reply in your post.arrow_forwardSetup time is very important in affecting a process and the capacity of a process. How do you reduce setup time? Give examples of reducing setup time. Please Provide a referenecearrow_forwardDo you think TPS was successful? If so, how? Are there other companies that have used TPS? If so, give examples. Please provide a referencearrow_forward
 Practical Management ScienceOperations ManagementISBN:9781337406659Author:WINSTON, Wayne L.Publisher:Cengage,
 MarketingMarketingISBN:9780357033791Author:Pride, William MPublisher:South Western Educational Publishing
 Purchasing and Supply Chain ManagementOperations ManagementISBN:9781285869681Author:Robert M. Monczka, Robert B. Handfield, Larry C. Giunipero, James L. PattersonPublisher:Cengage Learning