Explanation: Given The wave function for the electron in one dimensional system is, Ψ ( x ) = sin x The probability density curve for the function Ψ 2 ( x ) = sin 2 x contains all the positive values of the given function over the whole range. Therefore, the probability density curve for the given function is, Figure 1 (b) Explanation: Given The wave function for the electron in one dimensional system is, Ψ ( x ) = sin x The probability of finding electron for the given function is maximum on the values of x where the probability density curve has the maximum value. For the given function the value of sin x is maximum at the values x = π 2 and x = 3 π 2 . Therefore, the probability density curve for the given function has a peak at these values of x where probability of finding an electron is maximum. (c) Explanation: The wave function for the electron in one dimensional system is, Ψ ( x ) = sin x The probability of finding electron for the given function is minimum on the values of x where the probability density curve has the minimum value. For the given function the value of sin x is zero at the value of x = π . Therefore, the probability density curve for the given function has a node at this value of x where probability of finding electron is nil. Conclusion: (a) The probability density curve for the given function is as follows: (b) The values of x is maximum at x = π 2 and x = 3 π 2 . (c) The probability of finding an electron at x = π is zero and this point is called node.
Explanation: Given The wave function for the electron in one dimensional system is, Ψ ( x ) = sin x The probability density curve for the function Ψ 2 ( x ) = sin 2 x contains all the positive values of the given function over the whole range. Therefore, the probability density curve for the given function is, Figure 1 (b) Explanation: Given The wave function for the electron in one dimensional system is, Ψ ( x ) = sin x The probability of finding electron for the given function is maximum on the values of x where the probability density curve has the maximum value. For the given function the value of sin x is maximum at the values x = π 2 and x = 3 π 2 . Therefore, the probability density curve for the given function has a peak at these values of x where probability of finding an electron is maximum. (c) Explanation: The wave function for the electron in one dimensional system is, Ψ ( x ) = sin x The probability of finding electron for the given function is minimum on the values of x where the probability density curve has the minimum value. For the given function the value of sin x is zero at the value of x = π . Therefore, the probability density curve for the given function has a node at this value of x where probability of finding electron is nil. Conclusion: (a) The probability density curve for the given function is as follows: (b) The values of x is maximum at x = π 2 and x = 3 π 2 . (c) The probability of finding an electron at x = π is zero and this point is called node.
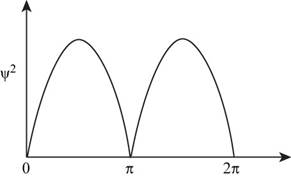
Given The wave function for the electron in one dimensional system is,
Ψ(x)=sinx
The probability density curve for the function Ψ2(x)=sin2x contains all the positive values of the given function over the whole range. Therefore, the probability density curve for the given function is,
Figure 1
(b)
Explanation:
Given The wave function for the electron in one dimensional system is,
Ψ(x)=sinx
The probability of finding electron for the given function is maximum on the values of x where the probability density curve has the maximum value. For the given function the value of sinx is maximum at the values x=π2 and x=3π2 . Therefore, the probability density curve for the given function has a peak at these values of x where probability of finding an electron is maximum.
(c)
Explanation: The wave function for the electron in one dimensional system is,
Ψ(x)=sinx
The probability of finding electron for the given function is minimum on the values of x where the probability density curve has the minimum value. For the given function the value of sinx is zero at the value of x=π . Therefore, the probability density curve for the given function has a node at this value of x where probability of finding electron is nil.
Conclusion:
(a) The probability density curve for the given function is as follows:
(b) The values of x is maximum at x=π2 and x=3π2 . (c) The probability of finding an electron at x=π is zero and this point is called node.
Experiment:
Each team will be provided with 5g of a mixture of acetanilide and salicylic acid. You will divide it into three 1.5 g portions in separate 125 mL Erlenmeyer flasks savıng some for melting point analysis. Dissolve the mixture in each flask in ~60mL of DI water by heating to boiling on a hotplate. Take the flasks off the hotplate once you have a clear solution and let them stand on the bench top for 5 mins and then allow them to cool as described below.
Sample A-Let the first sample cool slowly to room temperature by letting it stand on your lab bench, with occasional stirring to promote crystallization.
Sample B-Cool the second sample 1n a tap-water bath to 10-15 °C
Sample C-Cool the third sample in an ice-bath to 0-2 °C
Results:
weight after recrystalization and melting point temp.
A=0.624g,102-115°
B=0.765g, 80-105°
C=1.135g, 77-108
What is the percent yield of A,B, and C.
Rel. Intensity
Q
1. Which one of the following is true of the compound
whose mass spectrum is shown
here? Explain how you decided.
100
a) It contains chlorine.
b) It contains bromine.
c) It contains neither chlorine nor bromine.
80-
60-
40-
20-
0.0
0.0
TT
40
80
120
160
m/z
2. Using the Table of IR Absorptions how could you
distinguish between these two
compounds in the IR?
What absorbance would one compound have that the
other compound does not?
HO
CI
Illustrate reaction mechanisms of
alkenes with water in the presence of
H2SO4, detailing each step of the
process. Please show steps of
processing. Please do both, I will
thumb up for sure
#1
#3
Need a deep-dive on the concept behind this application? Look no further. Learn more about this topic, chemistry and related others by exploring similar questions and additional content below.
The Bohr Model of the atom and Atomic Emission Spectra: Atomic Structure tutorial | Crash Chemistry; Author: Crash Chemistry Academy;https://www.youtube.com/watch?v=apuWi_Fbtys;License: Standard YouTube License, CC-BY


 ChemistryChemistryISBN:9781305957404Author:Steven S. Zumdahl, Susan A. Zumdahl, Donald J. DeCostePublisher:Cengage Learning
 ChemistryChemistryISBN:9781259911156Author:Raymond Chang Dr., Jason Overby ProfessorPublisher:McGraw-Hill Education
 Principles of Instrumental AnalysisChemistryISBN:9781305577213Author:Douglas A. Skoog, F. James Holler, Stanley R. CrouchPublisher:Cengage Learning
 Organic ChemistryChemistryISBN:9780078021558Author:Janice Gorzynski Smith Dr.Publisher:McGraw-Hill Education
 Chemistry: Principles and ReactionsChemistryISBN:9781305079373Author:William L. Masterton, Cecile N. HurleyPublisher:Cengage Learning
 Elementary Principles of Chemical Processes, Bind...ChemistryISBN:9781118431221Author:Richard M. Felder, Ronald W. Rousseau, Lisa G. BullardPublisher:WILEY