Concept explainers
A company uses three different assembly lines—A1, A2 and A3—to manufacture a particular component. Of those manufactured by A1, 5% need rework to remedy a defect, whereas 8% of A2’s components and 10% of A3’s components need rework. Suppose that 50% of all components are produced by A1, 30% are produced by A2 and 20% are produced by A3.
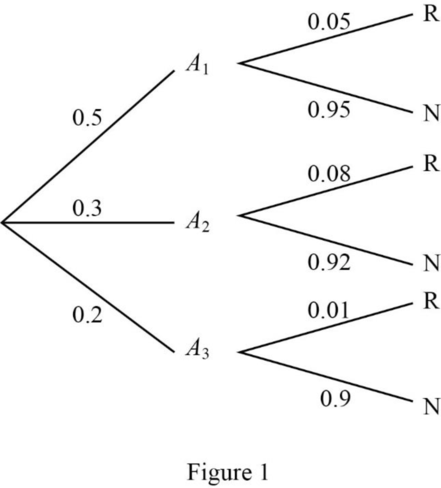
- a. Construct a tree diagram with first-generation branches corresponding to the three lines. Leading from each branch, draw one branch for rework (R) and another for no rework (N). Then enter appropriate probabilities on the branches.
- b. What is the
probability that a randomly selected component came from A1 and needed rework? - c. What is the probability that a randomly selected component needed rework?
a.
Draw a tree diagram with first-generation branches corresponds to the three lines.
Answer to Problem 87CR
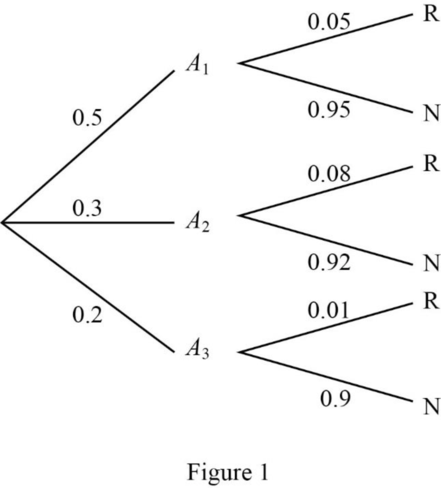
The tree diagram with first-generation branches corresponds to the three lines is:

Explanation of Solution
Calculation:
The given information is that about 50% of component manufactured by
Here, the probability of component manufactured by
The probability of component manufactured by
The probability of component manufactured by
The probability of component manufactured by
The probability of component manufactured by
The probability of component manufactured by
Tree diagram:
Tree diagram is a graphical representation of sample points. From a tree diagram, one can easily identify the sample points and number of sample points in the sample space.
The following tree diagram represents the given situation:

b.
Compute the probability that a randomly selected component came from
Answer to Problem 87CR
The probability that a randomly selected component came from
Explanation of Solution
Calculation:
The probability that a randomly selected component came from
Thus, the probability that a randomly selected component came from
c.
Find the probability that a randomly selected component need rework.
Answer to Problem 87CR
The probability that a randomly selected component need rework is 0.069.
Explanation of Solution
Calculation:
The probability that a randomly selected component need rework is calculated as follows:
Thus, the probability that a randomly selected component need rework is 0.069.
Want to see more full solutions like this?
Chapter 6 Solutions
Bundle: Introduction to Statistics and Data Analysis, 5th + WebAssign Printed Access Card: Peck/Olsen/Devore. 5th Edition, Single-Term
- 1. Suppose that, in Example 2.27, 400 units of food A, 600 units of B, and 600 units of C are placed in the test tube each day and the data on daily food consumption by the bacteria (in units per day) are as shown in Table 2.6. How many bacteria of each strain can coexist in the test tube and consume all of the food? Table 2.6 Bacteria Strain I Bacteria Strain II Bacteria Strain III Food A 1 2 0 Food B 2 1 1 Food C 1 1 2arrow_forwardBrian and Jennifer are planning to get married at the end of the year. They read that certain diets are healthier for specific blood types and hope that they both have the same blood type. Unfortunately, neither Brian nor Jennifer can remember their blood type. Suppose a recent study shows that 28% of adults have blood type A, 21% of adults have blood type B, 34% of adults have blood type AB, and 17% of adults have blood type O. The tree diagram shows the possible outcomes for Brian and Jennifer along with their associated probabilities. What is the probability that Brian and Jennifer share the same blood type? Give your answer as a decimal, precise to at least two decimal places. ?(Brian and Jennifer have the same blood type) = Suppose a county’s recent health report gives a pet allergy prevalence of 0.15 for kids. There is a new at-home test kit for pet allergies on the market that provides families with a convenient way to test if children have a pet allergy. The…arrow_forwardConsider there are only two computer companies in a country. The companies are named “Dude” and “Imac”. Each year, company Dude keeps 1/5th of its customers, while the rest switch to Imac. Each year, Imac keeps 1/3rd of its customers, while the rest switch to Dude. If in 2002, Dude has 1/6th of the market and Imac has 5/6th of the market, what is the distribution of the market share between the two companies in 2003. (Hint: you can cast this as a matrix multiplication problem)arrow_forward
- Brian and Jennifer are planning to get married at the end of the year. They read that certain diets are healthier for specific blood types and hope that they both have the same blood type. Unfortunately, neither Brian nor Jennifer can remember their blood type. Suppose a recent study shows that 21% of adults have blood type A, 34% of adults have blood type B, 38% of adults have blood type AB, and 7% of adults have blood type O. The tree diagram shows the possible outcomes for Brian and Jennifer along with their associated probabilities. What is the probability that Brian and Jennifer share the same blood type? Give your answer as a decimal, precise to at least two decimal places. ?(Brian and Jennifer have the same blood type)P(Brian and Jennifer have the same blood type) =arrow_forwardA college offers three types of programs: bachelors, Masters, and Doctorate. In the recent past, 70% of the students started the Bachelors program, 25% started the Masters program, and 5% started the PhD program. Of students starting the Bachelors program, 15% did not finish their degree; of students starting the Masters program, 34% did not finish their degree; and of students starting the PhD program, 42% did not finish their degree. Draw a tree diagram including the probabilities for each branch. If a student is selected at random, find the probability that they did not finish the program.arrow_forwardFormer pro football star O.J. Simpson was accused of murdering his wife. In the trial, a defense attorney pointed out that although Simpson had been guilty of earlier spousal abuse, annually only about 40 women are murdered by their partner per 100,000 incidents of partner abuse. But this was misleading. Every year it is estimated that about 5 of every 100,000 women in the US who suffer partner abuse are killed by someone other than their partner. Draw a tree diagram for women who suffer partner abuse. Calculate the following (round to 5 decimal places):a) What is the probability that a woman who suffers partner abuse will be murdered by their partner?b) What is the probability that a woman who suffers partner abuse will be murdered (by anyone)?c) What is the probability that a murdered woman who suffered partner abuse was murdered by their partner?arrow_forward
- III. A researcher is interested in what type of bait attracts the most moths. The number of moths in a trap was recorded for traps that were in different locations, and used different baits. The data is in the file Trap.csv, with the following columns: Column 1. Moths: The number of moths in the trap Column 2. Location: The location of the trap on a tree Top, Middle, Lower, Ground. - Column 3. Bait: Chemical The bait used - Scent, Sugar, (a) Plot the interaction plot. Does there appear to be an interaction effect? Explain your answer. (b) Find the group means for Location. (c) Find the group means for Bait. (d) Find the group means for all treatment levels. (e) Do you believe that the number of moths trapped is different for all Locations? Explain.arrow_forwardIn a survey conducted by Health Ministry on prevalence of diabetes disease among senior citizens, those above 60 year-old, the following are the published information: 55% of the respondents are Malay and 25% of them are diabetics; 25% of the respondents are Chinese and 20% of them are diabetics; 20% of the respondents are Indian and 15% of them are diabetics. (а) Illustrate the above published information in a tree diagram. If a senior citizen is picked at random, find the probability that he/she is a diabetic. (b) (c) Suppose that a senior citizen is diabetic, find the probability that he/she is Malay.arrow_forwardRecords of a company show that 15% of the employees have only a high school diploma; 70% have bachelor degrees; and 15% have graduate degrees. Of those with only a high school diploma, 10% hold management positions; whereas, of those having bachelor degrees, 65% hold management positions. Finally, 80% of the employees who have graduate degrees hold management positions. Create a tree diagram representing the above situation. What percentage of employees hold management positions Given that a person holds a management position, what is the probability that she/he has a graduate degreearrow_forward
- A company that offers courses to prepare future MBA students for the GMAT exam finds that 40% of its clients are currently undergraduate students and 60% are college graduates. After completing the course, 50% of college students and 70% of graduates score at least 600 on the GMAT. Use a tree diagram to organize this information. What percentage of all clients score at least 600 on the GMAT? Select one: to. 42% b. 62% c. twenty% d. 38%arrow_forwardAsaparrow_forwardExercise 10.3.4: Selecting coders for 3 different projects. i About (a) A manager must select three coders from her group to write three different software projects. There are 7 junior and 3 senior coders in her group. The first project can be written by any of the coders. The second project must be written by a senior person and the third project must be written by a junior person. How many ways are there for her to assign the three coders to the projects if no person can be assigned to more than one project?arrow_forward
 Linear Algebra: A Modern IntroductionAlgebraISBN:9781285463247Author:David PoolePublisher:Cengage Learning
 Glencoe Algebra 1, Student Edition, 9780079039897...AlgebraISBN:9780079039897Author:CarterPublisher:McGraw Hill

