
Videos
Critical Thinking:
Designing aircraft seats
When designing seats for aircraft, we want to have sufficient room so that passengers are comfortable and safe, but we don’t want too much room, because fewer seats could be installed and profits would drop. It has been estimated that removing one row of seats would cost around $8 million over the life of an aircraft.
Figure 6-22(a) shows an important human consideration: The buttock-to-knee length. The accompanying table includes relevant buttock- to-knee length parameters obtained from studies of large numbers of people. Figure 6-22(b) shows a traditional aircraft seat, and Figure 6-22(c) shows the new SkyRider seat design by the Italian company Aviointeriors. The SkyRider seat is dramatically different from traditional aircraft seats. The seats are like saddles, and they are higher so that passenger legs slant downward with weight on the legs. The most dramatic difference is that SkyRider seats have much less legroom. The distance of 23 in. shown in Figure 6-22(c) is a distance of 30 in. to 32 in. for most current economy seats. As of this writing, the SkyRider seats have not yet been approved by the Federal Aviation Administration, but approval would allow a new class of seating with very low fares.
When designing aircraft seats, we must make some hard choices. If we are to accommodate everyone in the population, we will have a sitting distance that is so costly in terms of reduced seating that it might not be economically feasible. Some questions we must address are: (1) What percentage of the population are we willing to exclude? (2) How much extra room do we want to provide for passenger comfort and safety?
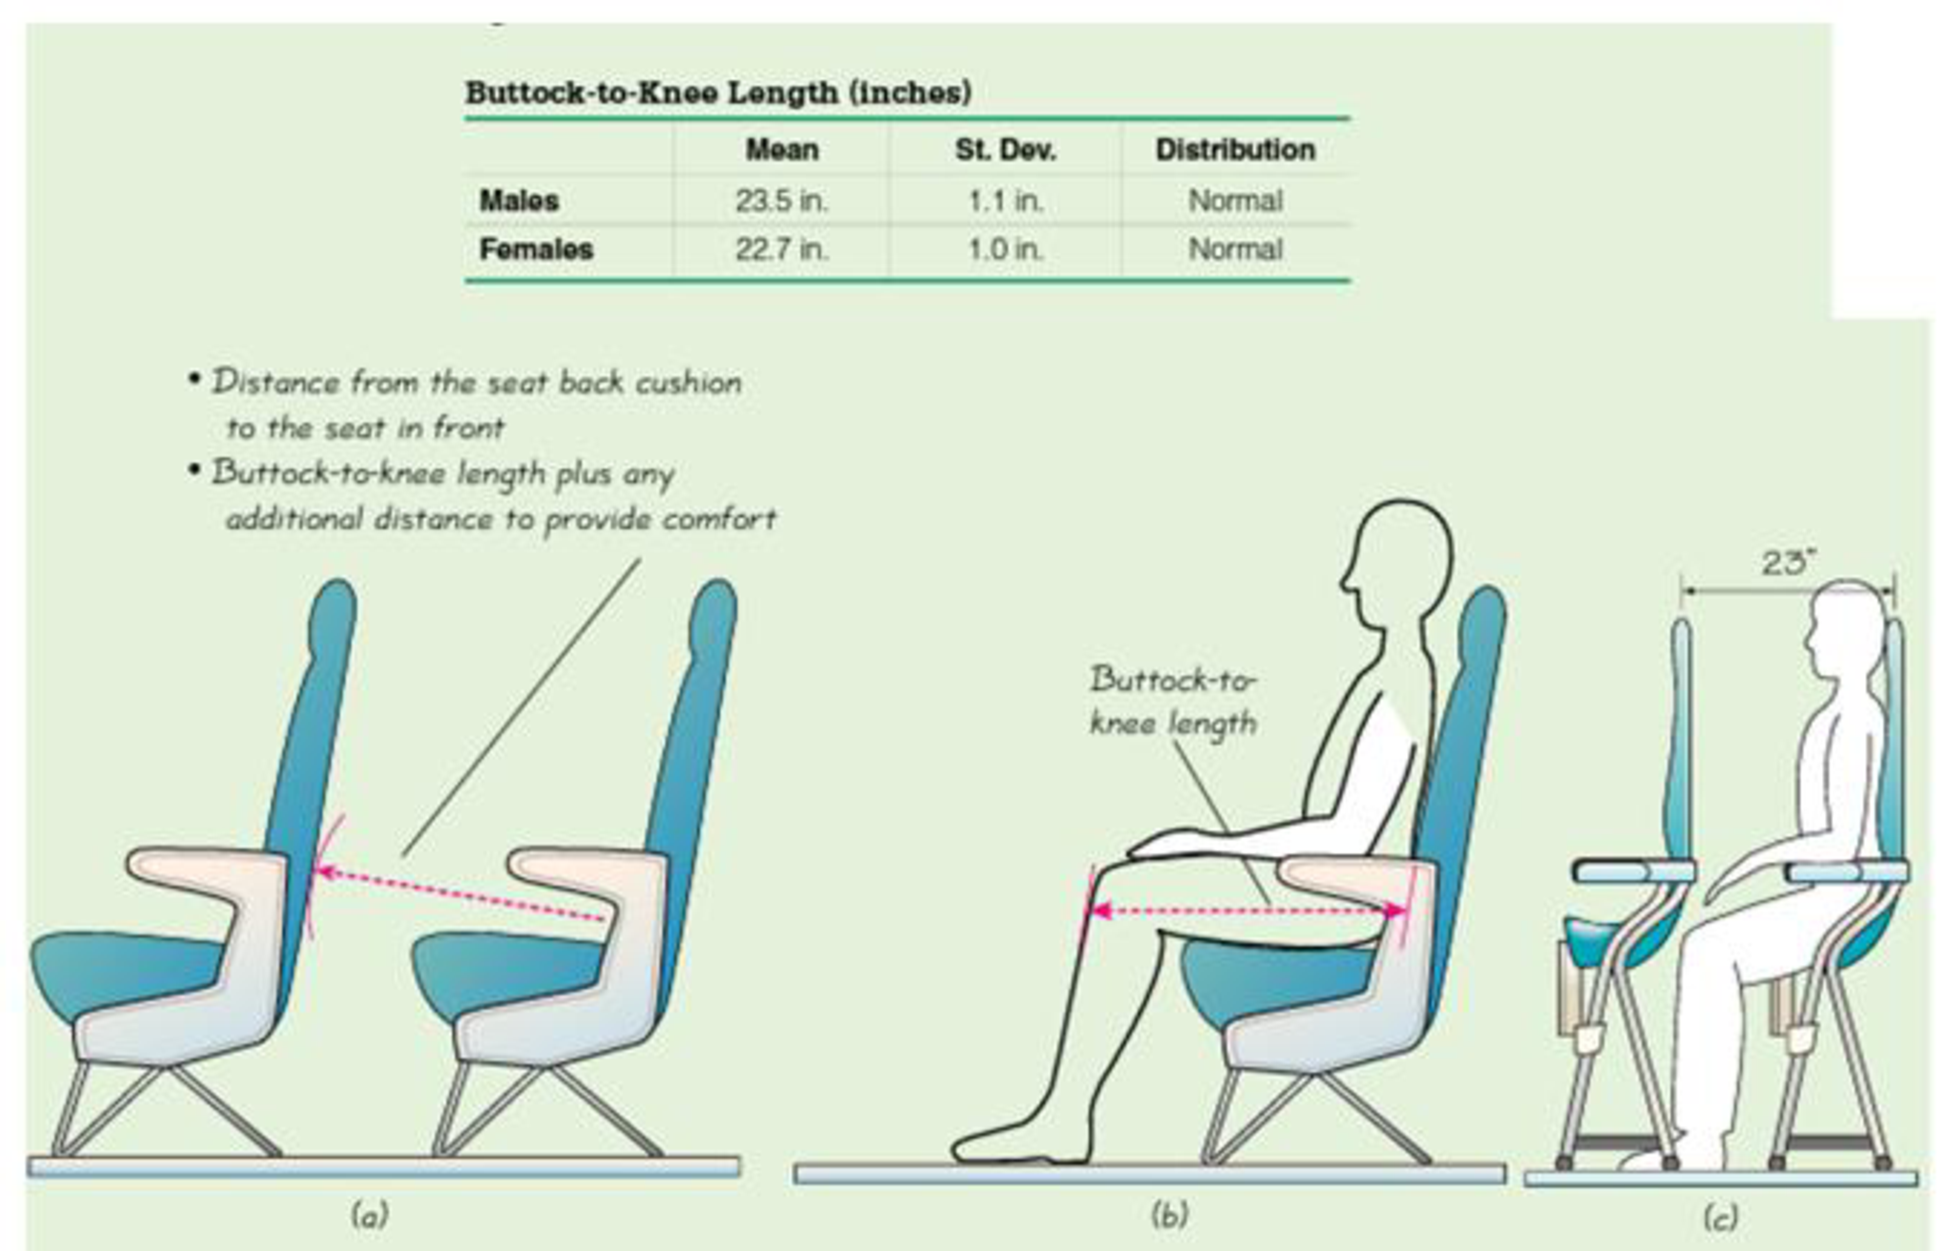
Figure 6-22 Distances Used In the Design of Aircraft Seats
6. Based on the preceding results, what would you tell an engineer who is designing and configuring seats for an aircraft?
Want to see the full answer?
Check out a sample textbook solution
Chapter 6 Solutions
Essentials of Statistics (5th Edition)


- F Make a box plot from the five-number summary: 100, 105, 120, 135, 140. harrow_forward14 Is the standard deviation affected by skewed data? If so, how? foldarrow_forwardFrequency 15 Suppose that your friend believes his gambling partner plays with a loaded die (not fair). He shows you a graph of the outcomes of the games played with this die (see the following figure). Based on this graph, do you agree with this person? Why or why not? 65 Single Die Outcomes: Graph 1 60 55 50 45 40 1 2 3 4 Outcome 55 6arrow_forward
- lie y H 16 The first month's telephone bills for new customers of a certain phone company are shown in the following figure. The histogram showing the bills is misleading, however. Explain why, and suggest a solution. Frequency 140 120 100 80 60 40 20 0 0 20 40 60 80 Telephone Bill ($) 100 120arrow_forward25 ptical rule applies because t Does the empirical rule apply to the data set shown in the following figure? Explain. 2 6 5 Frequency 3 сл 2 1 0 2 4 6 8 00arrow_forward24 Line graphs typically connect the dots that represent the data values over time. If the time increments between the dots are large, explain why the line graph can be somewhat misleading.arrow_forward
- 17 Make a box plot from the five-number summary: 3, 4, 7, 16, 17. 992) waarrow_forward12 10 - 8 6 4 29 0 Interpret the shape, center and spread of the following box plot. brill smo slob.nl bagharrow_forwardSuppose that a driver's test has a mean score of 7 (out of 10 points) and standard deviation 0.5. a. Explain why you can reasonably assume that the data set of the test scores is mound-shaped. b. For the drivers taking this particular test, where should 68 percent of them score? c. Where should 95 percent of them score? d. Where should 99.7 percent of them score? Sarrow_forward
- 13 Can the mean of a data set be higher than most of the values in the set? If so, how? Can the median of a set be higher than most of the values? If so, how? srit to estaarrow_forwardA random variable X takes values 0 and 1 with probabilities q and p, respectively, with q+p=1. find the moment generating function of X and show that all the moments about the origin equal p. (Note- Please include as much detailed solution/steps in the solution to understand, Thank you!)arrow_forward1 (Expected Shortfall) Suppose the price of an asset Pt follows a normal random walk, i.e., Pt = Po+r₁ + ... + rt with r₁, r2,... being IID N(μ, o²). Po+r1+. ⚫ Suppose the VaR of rt is VaRq(rt) at level q, find the VaR of the price in T days, i.e., VaRq(Pt – Pt–T). - • If ESq(rt) = A, find ES₁(Pt – Pt–T).arrow_forward
 Trigonometry (MindTap Course List)TrigonometryISBN:9781305652224Author:Charles P. McKeague, Mark D. TurnerPublisher:Cengage Learning
 Algebra and Trigonometry (MindTap Course List)AlgebraISBN:9781305071742Author:James Stewart, Lothar Redlin, Saleem WatsonPublisher:Cengage Learning
 Holt Mcdougal Larson Pre-algebra: Student Edition...AlgebraISBN:9780547587776Author:HOLT MCDOUGALPublisher:HOLT MCDOUGAL
 Mathematics For Machine TechnologyAdvanced MathISBN:9781337798310Author:Peterson, John.Publisher:Cengage Learning,