
Interpretation:
Each line in the phase diagram, in terms of the derivative it represents, is to be labeled.
Concept introduction:
Phase diagram represents the different physical states of a substance at different values of temperature and pressure. In the water, the molar volume of solid is greater than the molar volume of the liquid.
Answer to Problem 6.66E
The phase transition between solid phase to liquid phase is represented by the derivative,
The phase transition between solid phase to liquid phase is represented by the derivative,
The phase transition between solid phase to liquid phase is represented by the derivative,
The phase transition between solid phases is represented by the derivative,
Explanation of Solution
The phase diagram of water shown in Figure 6.6 is shown below.
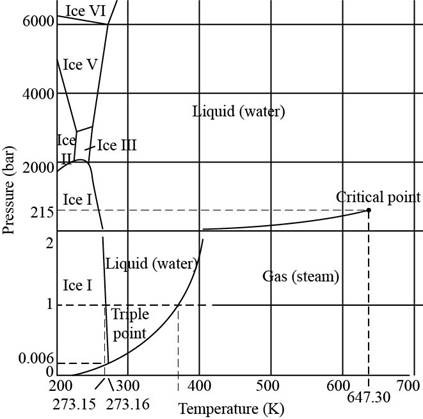
Figure 1
In the given diagram, the total numbers of phase transitions represented are,
1. Gas phase to liquid phase
2. Gas phase to ice phase
3. Liquid phase to ice phase
4. Liquid phase to ice phase
5. Liquid phase to ice phase
6. Liquid phase to ice phase
7. Ice phase
8. Ice phase
9. Ice phase
10. Ice phase
11. Ice phase
12. Ice phase
Thus, the total number of phase transitions are
The phase transition between solid phase to liquid phase, that is, ice phase
Where,
•
•
The phase transition between gas phase to ice phase
Where,
•
•
The volume of gas is much greater than the volume of solid. Therefore, it can be neglected.
The phase transition between solid phase and liquid phase is represented by the derivative,
Where,
•
•
The volume of gas is much greater than the volume of liquid. Therefore, it can be neglected.
The phase transition between solid phases is represented by the derivative,
Where,
•
•
The phase transition between solid phase to liquid phase is represented by the derivative,
The phase transition between solid phase to liquid phase is represented by the derivative,
The phase transition between solid phase to liquid phase is represented by the derivative
The phase transition between solid phases is represented by the derivative,
Want to see more full solutions like this?
Chapter 6 Solutions
Bundle: Physical Chemistry, 2nd + Student Solutions Manual

- Determine the structures of the missing organic molecules in the following reaction: X+H₂O H* H+ Y OH OH Note: Molecules that share the same letter have the exact same structure. In the drawing area below, draw the skeletal ("line") structures of the missing organic molecules X and Y. You may draw the structures in any arrangement that you like, so long as they aren't touching. Click and drag to start drawing a structure. X Sarrow_forwardPredict the major products of this organic reaction. If there aren't any products, because nothing will happen, check the box under the drawing area instead. No reaction. HO. O :☐ + G Na O.H Click and drag to start drawing a structure. XS xs H₂Oarrow_forwardWhat are the angles a and b in the actual molecule of which this is a Lewis structure? H H C H- a -H b H Note for advanced students: give the ideal angles, and don't worry about small differences from the ideal groups may have slightly different sizes. a = b = 0 °arrow_forward
- What are the angles a and b in the actual molecule of which this is a Lewis structure? :0: HCOH a Note for advanced students: give the ideal angles, and don't worry about small differences from the ideal that might be caused by the fact that different electron groups may have slightly different sizes. a = 0 b=0° Sarrow_forwardDetermine the structures of the missing organic molecules in the following reaction: + H₂O +H OH O OH +H OH X Note: Molecules that share the same letter have the exact same structure. In the drawing area below, draw the skeletal ("line") structure of the missing organic molecule X. Click and drag to start drawing a structure.arrow_forwardIdentify the missing organic reactant in the following reaction: x + x O OH H* + ☑- X H+ O O Х Note: This chemical equation only focuses on the important organic molecules in the reaction. Additional inorganic or small-molecule reactants or products (like H₂O) are not shown. In the drawing area below, draw the skeletal ("line") structure of the missing organic reactant X. Click and drag to start drawing a structure. Carrow_forward
- CH3O OH OH O hemiacetal O acetal O neither O 0 O hemiacetal acetal neither OH hemiacetal O acetal O neither CH2 O-CH2-CH3 CH3-C-OH O hemiacetal O acetal CH3-CH2-CH2-0-c-O-CH2-CH2-CH3 O neither HO-CH2 ? 000 Ar Barrow_forwardWhat would be the best choices for the missing reagents 1 and 3 in this synthesis? 1. PPh3 2 2. n-BuLi 3 Draw the missing reagents in the drawing area below. You can draw them in any arrangement you like. • Do not draw the missing reagent 2. If you draw 1 correctly, we'll know what it is. • Note: if one of your reagents needs to contain a halogen, use bromine. Explanation Check Click and drag to start drawing a structure.arrow_forwardPredict the products of this organic reaction: NaBH3CN + NH2 ? H+ Click and drag to start drawing a structure. ×arrow_forward
- Predict the organic products that form in the reaction below: + OH +H H+ ➤ ☑ X - Y Note: You may assume you have an excess of either reactant if the reaction requires more than one of those molecules to form the products. In the drawing area below, draw the skeletal ("line") structures of the missing organic products X and Y. You may draw the structures in any arrangement that you like, so long as they aren't touching. Click and drag to start drawing a structure. Garrow_forwardPredict the organic products that form in the reaction below: OH H+ H+ + ☑ Y Note: You may assume you have an excess of either reactant if the reaction requires more than one of those molecules to form the products. In the drawing area below, draw the skeletal ("line") structures of the missing organic products X and Y. You may draw the structures in any arrangement that you like, so long as they aren't touching. Click and drag to start drawing a structure. ✓ marrow_forwardDetermine the structures of the missing organic molecules in the following reaction: + H₂O +H H+ Y Z ☑ ☑ Note: Molecules that share the same letter have the exact same structure. In the drawing area below, draw the skeletal ("line") structures of the missing organic molecules X, Y, and Z. You may draw the structures in any arrangement that you like, so long as they aren't touching. Molecule X shows up in multiple steps, but you only have to draw its structure once. Click and drag to start drawing a structure. AP +arrow_forward
 Chemistry: Matter and ChangeChemistryISBN:9780078746376Author:Dinah Zike, Laurel Dingrando, Nicholas Hainen, Cheryl WistromPublisher:Glencoe/McGraw-Hill School Pub Co
 Introductory Chemistry: A FoundationChemistryISBN:9781337399425Author:Steven S. Zumdahl, Donald J. DeCostePublisher:Cengage Learning
 Chemistry: The Molecular ScienceChemistryISBN:9781285199047Author:John W. Moore, Conrad L. StanitskiPublisher:Cengage Learning
 Physical ChemistryChemistryISBN:9781133958437Author:Ball, David W. (david Warren), BAER, TomasPublisher:Wadsworth Cengage Learning,
 Chemistry: Principles and ReactionsChemistryISBN:9781305079373Author:William L. Masterton, Cecile N. HurleyPublisher:Cengage Learning