Principles Of Macroeconomics V 8.0
18th Edition
ISBN: 9781453378717
Author: Taylor
Publisher: BOSTON ACADEMIC (DBA FLAT WORLD)
expand_more
expand_more
format_list_bulleted
Textbook Question
Chapter 6, Problem 4SCQ
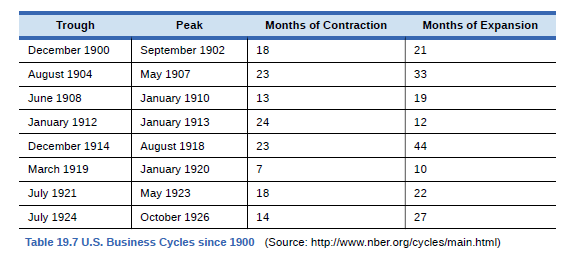
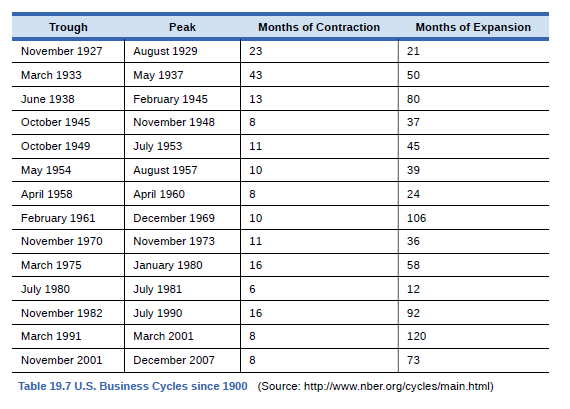
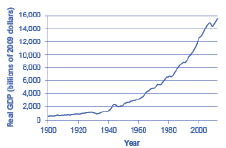
Without looking at Table 19.7, return to Figure 19.10. If we define a recession as a significant decline in national output, can you identify any post-1960 recessions in addition to the


Expert Solution & Answer
Want to see the full answer?
Check out a sample textbook solution
Students have asked these similar questions
(d) Calculate the total change in qı.
Total change:
007
(sp) S
to vlijnsi
(e) B₁ is our original budget constraint and B2 is our new budget constraint after the price of good 1 (p1) increased.
Decompose the change in qı (that occurred from the increase in p₁) into the income and substitution effects. It
is okay to estimate as needed via visual inspection. Add any necessary information to the graph to support your
03
answer.
Substitution Effect:
Income Effect:
everything is in image (8 and 10) there are two images each separate questions
everything is in the picture (13)
the first blank has the options (an equilibrium or a surplus)
the second blank has the options (a surplus or a shortage)
Chapter 6 Solutions
Principles Of Macroeconomics V 8.0
Ch. 6 - Country A has export sales of 20 billion,...Ch. 6 - Which of the following are included in GDP, and...Ch. 6 - Using data from Table 19.5 how much of the nominal...Ch. 6 - Without looking at Table 19.7, return to Figure...Ch. 6 - According to Table 19.7, how often have recessions...Ch. 6 - According to Table 19.7, how long has the average...Ch. 6 - According to Table 19.7, how long has the average...Ch. 6 - Is it possible for GDP to rise while at the same...Ch. 6 - The Central African Republic has a GDP of...Ch. 6 - Explain briefly whether each of the following...
Ch. 6 - What are the main components of measuring GDP with...Ch. 6 - What are the main components of measuring GDP with...Ch. 6 - Would you usually expect GDP as measured by what...Ch. 6 - Why must you avoid double counting when measuring...Ch. 6 - What is the difference between a series of...Ch. 6 - How do you convert a series of nominal economic...Ch. 6 - What are typical GDP patterns for a high-income...Ch. 6 - What are the two main difficulties that arise in...Ch. 6 - List some of the reasons why economists should not...Ch. 6 - U.S. macroeconomic data are among the best in the...Ch. 6 - What does GDP not tell us about the economy?Ch. 6 - Should people typically pay more attention to...Ch. 6 - Why do you suppose that U.S. GDP is so much higher...Ch. 6 - Why do you think that GDP does not grow at a...Ch. 6 - Cross country comparisons of GDP per capita...Ch. 6 - Why might per capita GDP be only an imperfect...Ch. 6 - How might you measure a green GDP?Ch. 6 - Last year, a small nation with abundant forests...Ch. 6 - The prime interest rate is the rate that banks...Ch. 6 - A mortgage 105m is a loan that a person makes to...Ch. 6 - Ethiopia has a GDP of 8 billion (measured in U.S....Ch. 6 - In 1980, Denmark had a GDP of 70 billion (measured...Ch. 6 - The Czech Republic has 3 GDP of 1,800 billion...
Additional Business Textbook Solutions
Find more solutions based on key concepts
Comparison of projects using Net Present Value. Reasons for the conflicts in ranking using Net Present Value an...
Gitman: Principl Manageri Finance_15 (15th Edition) (What's New in Finance)
(Future and present value using a calculator) In 2016 Bill Gates was worth about $82 billion. Let’s see what Bi...
Foundations Of Finance
Quick ratio and current ratio (Learning Objective 7) 1520 min. Consider the following data COMPANY A B C D Cash...
Financial Accounting, Student Value Edition (5th Edition)
How is inventory tracked under a perpetual inventory system?
Intermediate Accounting (2nd Edition)
1.10 Brown’s, a local bakery, is worried about increased costs—particularly energy. Last year’s records can pro...
Operations Management
E6-14 Using accounting vocabulary
Learning Objective 1, 2
Match the accounting terms with the corresponding d...
Horngren's Accounting (12th Edition)
Knowledge Booster
Similar questions
- everything is in photo (19)arrow_forwardIn announcing tariffs on imported steel and aluminum last week, the President said he was imposing a tax on foreign manufacturers who seek to export to the U.S. Is that a fair description of what he did and who will pay? Explain your answer.arrow_forwardAnticipating a severe winter storm, stores stock up on snow shovels and consumers buy snow shovels to be able to clear access to their property. What happens to the price and quantity of snow shovels in the days leading up to the stormarrow_forward
- In the context of supply and demand, describe what equilibrium means? Can a shortage or surplus exist in a market that is left to its own devices? Explain.arrow_forwardTypically, spending in an economy is divided into four components. What are they? Which is the largest component? Which is the most steady from one period to another? Which is most volatile from one period to another? Explain why for your two previous answers.arrow_forwardMichelle Wie, a teenage golf prodigy, earned $16 million from endorsements and $4 million in prize money in 2006. In 2007, she announced that she would enroll in Stanford University for the Fall term. What was her opportunity cost for the 2007-2008 academic year? How does it compare to your opportunity cost of a year at University?arrow_forward
arrow_back_ios
SEE MORE QUESTIONS
arrow_forward_ios
Recommended textbooks for you


 Macroeconomics: Private and Public Choice (MindTa...EconomicsISBN:9781305506756Author:James D. Gwartney, Richard L. Stroup, Russell S. Sobel, David A. MacphersonPublisher:Cengage Learning
 Economics: Private and Public Choice (MindTap Cou...EconomicsISBN:9781305506725Author:James D. Gwartney, Richard L. Stroup, Russell S. Sobel, David A. MacphersonPublisher:Cengage Learning


Macroeconomics: Private and Public Choice (MindTa...
Economics
ISBN:9781305506756
Author:James D. Gwartney, Richard L. Stroup, Russell S. Sobel, David A. Macpherson
Publisher:Cengage Learning

Economics: Private and Public Choice (MindTap Cou...
Economics
ISBN:9781305506725
Author:James D. Gwartney, Richard L. Stroup, Russell S. Sobel, David A. Macpherson
Publisher:Cengage Learning
