Concept explainers
Sales Let S represent sales of a new product (in thousands of units), let L, represent the maximum level of sales (in thousands of units), and let t represent time (in months). The rate of change of S with respect to t is proportional to the product of S and
(a) Write the
When t = 0: L = 100, S = 10
When t = 1: S = 20
Verify that
(b) At what time is the growth in sales increasing most rapidly?
(c) Use a graphing utility to graph the sales function.
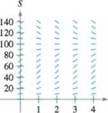
(d) Sketch the solution from part (a) on the slope field below. To print an enlarged copy of the graph, go to MathGraphs.com.

(e) Assume the estimated maximum level of sales is correct. Use the slope field to describe the shape of the solution curves for sales when, at some period of time, sales exceed L.
Want to see the full answer?
Check out a sample textbook solution
Chapter 6 Solutions
Calculus: Early Transcendental Functions
- Graph y=log2(x+3) 10+ 9 8 7- 6 5 4 3 3 2 1 10 -9 -8 -7 -6 -5 -4 -3-2-1 1 2 3 4 5 6 7 8 7 8 9 10 -1 -2 -3 -4 -5 -6 -7- -8 -9 -10 Clear All Drawarrow_forwardWrite an equation for the graph below. +10+ 9 10 -9 -8 -7 -6 -5 -4 -3-2-1 8 7 6 5 4 3 2 1 1 3 4 5 6 7 8 9 10 -1 -2 -3 -4 -5 -6 -7 -8 f(x) = 9 -9 -10-arrow_forward3. Solve the inequality and give your answer in interval notation. Be sure to show all your work, and write neatly so your work is easy to follow. (4 points) 2|3x+12 ≥ 18arrow_forward
- - 2. In words, interpret the inequality |x8|> 7 the same way I did in the videos. Note: the words "absolute value" should not appear in your answer! (2 points)arrow_forwardFind the tangential and normal components of the acceleration vector for the curve (t) = (2t, -3t5,-3+4) at the point t = 1 ā(1) = T + N Give your answers to two decimal placesarrow_forwardA gun is fired with muzzle velocity 1152 feet per second at a target 4150 feet away. Find the minimum angle of elevation necessary to hit the target. Assume the initial height of the bullet is 0 feet, neglect air resistance, and give your answer in degrees.arrow_forward
- "Use the Opposite Method to solve the following differential equation:" 4'"""" + 34" + 34 + 4 = xarrow_forwardFor the curve defined by (t) = (e cos(t), et sin(t)) find the unit tangent vector, unit normal vector, normal acceleration, and tangential acceleration at πT t = 3 П I(3) 丌_3_3 N (1) ат aN || = = =arrow_forwardFind the velocity vector for the position vector (t) = (sin(9+), 9t10, e¯7). x component = y component = Z component =arrow_forward
- In the xy-plane, an angle 0, in standard position, has a measure of the following is true? T. Which of 3 A The slope of the terminal ray of the angle is 1. B The slope of the terminal ray of the angle is 1. C D 3 The slope of the terminal ray of the angle is ✓ 2 The slope of the terminal ray of the angle is √3.arrow_forwardy'''-3y''+4y=e^2x Find particular solutionarrow_forward1 -1- Ο Graph of f y = + y = 1 + 1/2 ·2· x Graph of g y = 1- 플 The figure gives the graphs of the functions f and g in the xy-plane. The function of is given by f(x) = tan¹ x. Which of the following defines g(x)? A tan 1 x + 1 B - tan 1 x + П 2 C tan-1 (2/2) + 1 D tan-1 (2/2) + 1/1arrow_forward
 Glencoe Algebra 1, Student Edition, 9780079039897...AlgebraISBN:9780079039897Author:CarterPublisher:McGraw Hill
 Big Ideas Math A Bridge To Success Algebra 1: Stu...AlgebraISBN:9781680331141Author:HOUGHTON MIFFLIN HARCOURTPublisher:Houghton Mifflin Harcourt
 Functions and Change: A Modeling Approach to Coll...AlgebraISBN:9781337111348Author:Bruce Crauder, Benny Evans, Alan NoellPublisher:Cengage Learning
 Linear Algebra: A Modern IntroductionAlgebraISBN:9781285463247Author:David PoolePublisher:Cengage Learning
 College Algebra (MindTap Course List)AlgebraISBN:9781305652231Author:R. David Gustafson, Jeff HughesPublisher:Cengage Learning


