
Concept explainers
Videos
Palisade Creek Co. is a merchandising business that uses the perpetual inventory system. The account balances for Palisade Creek Co. as of May 1, 2019 (unless otherwise indicated), are as follows:
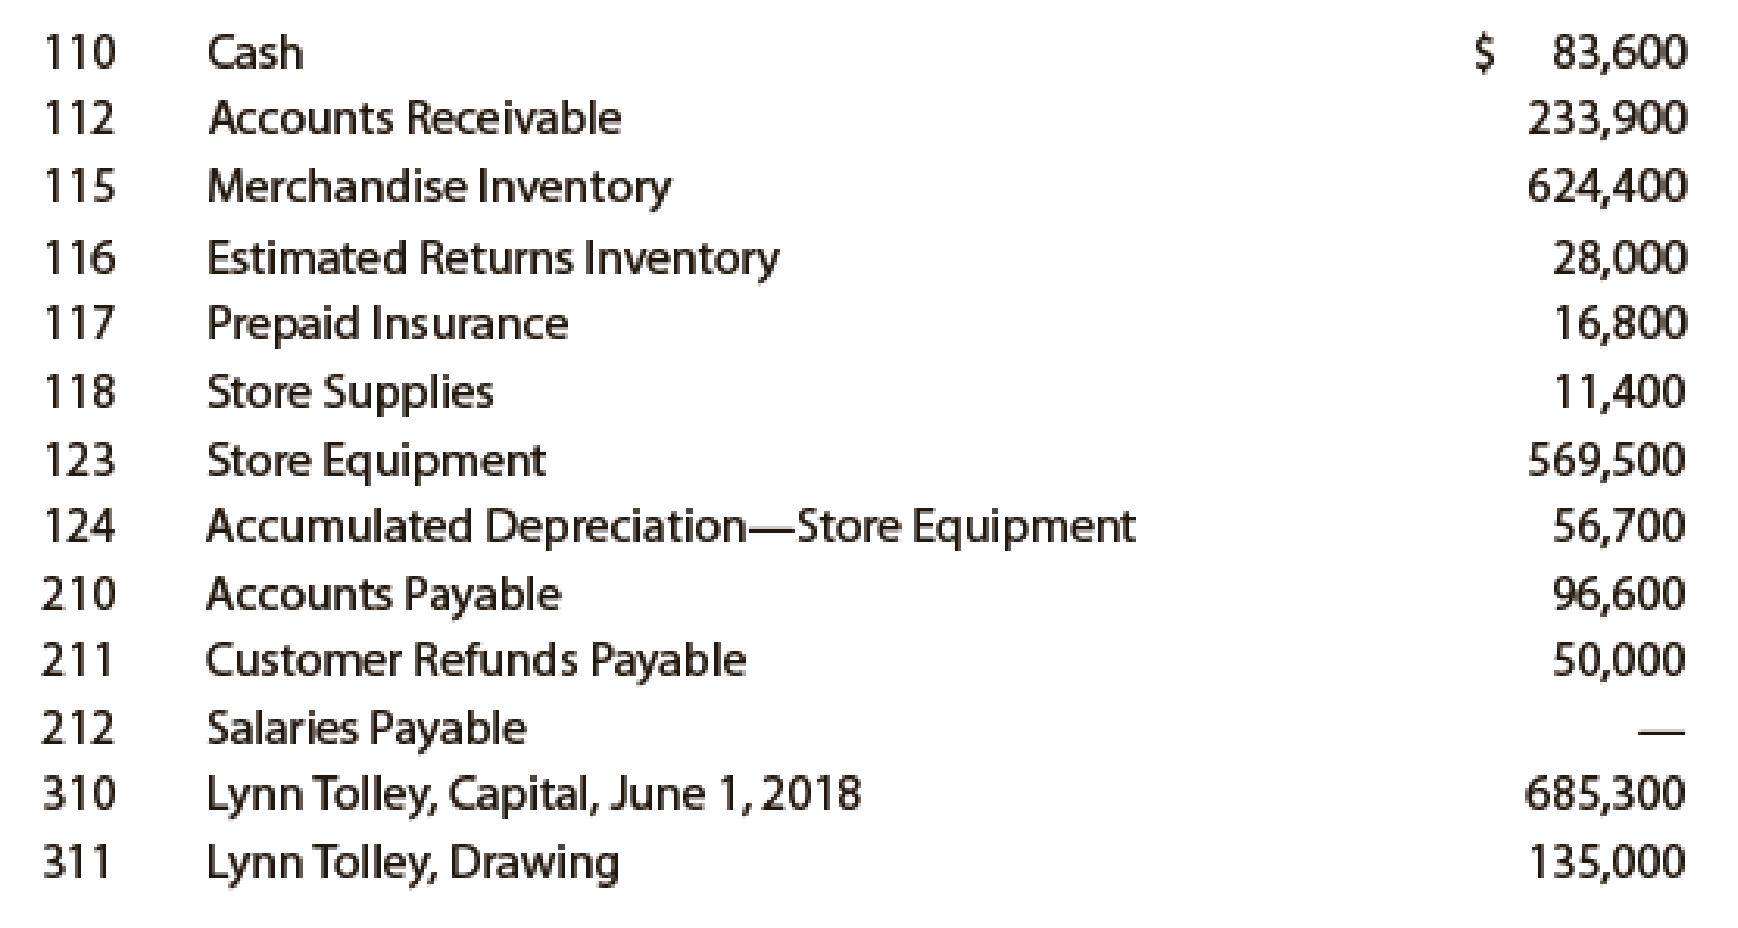
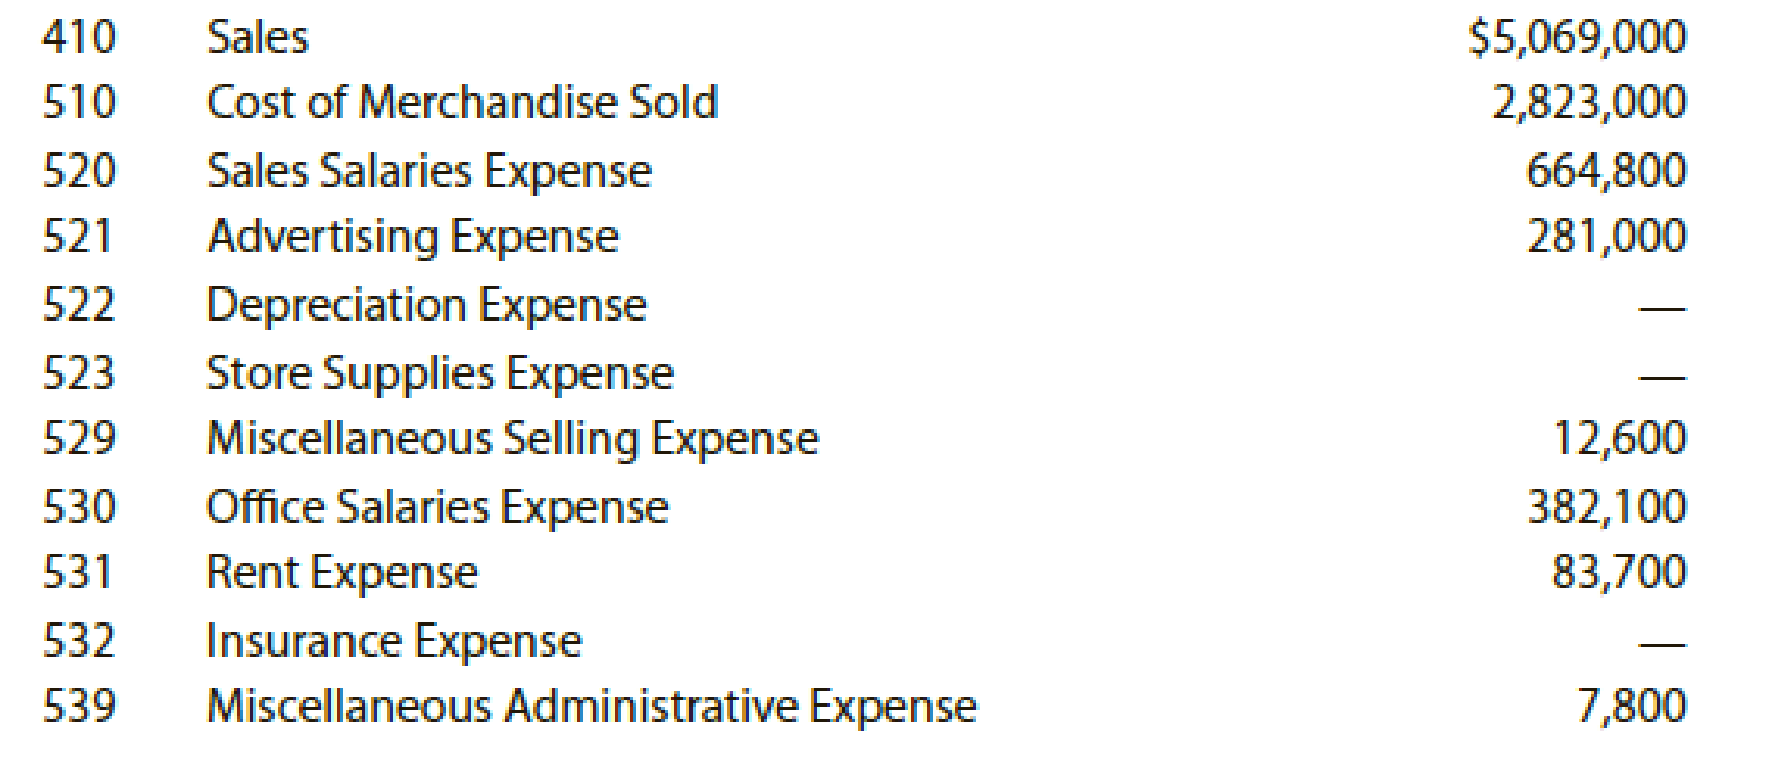
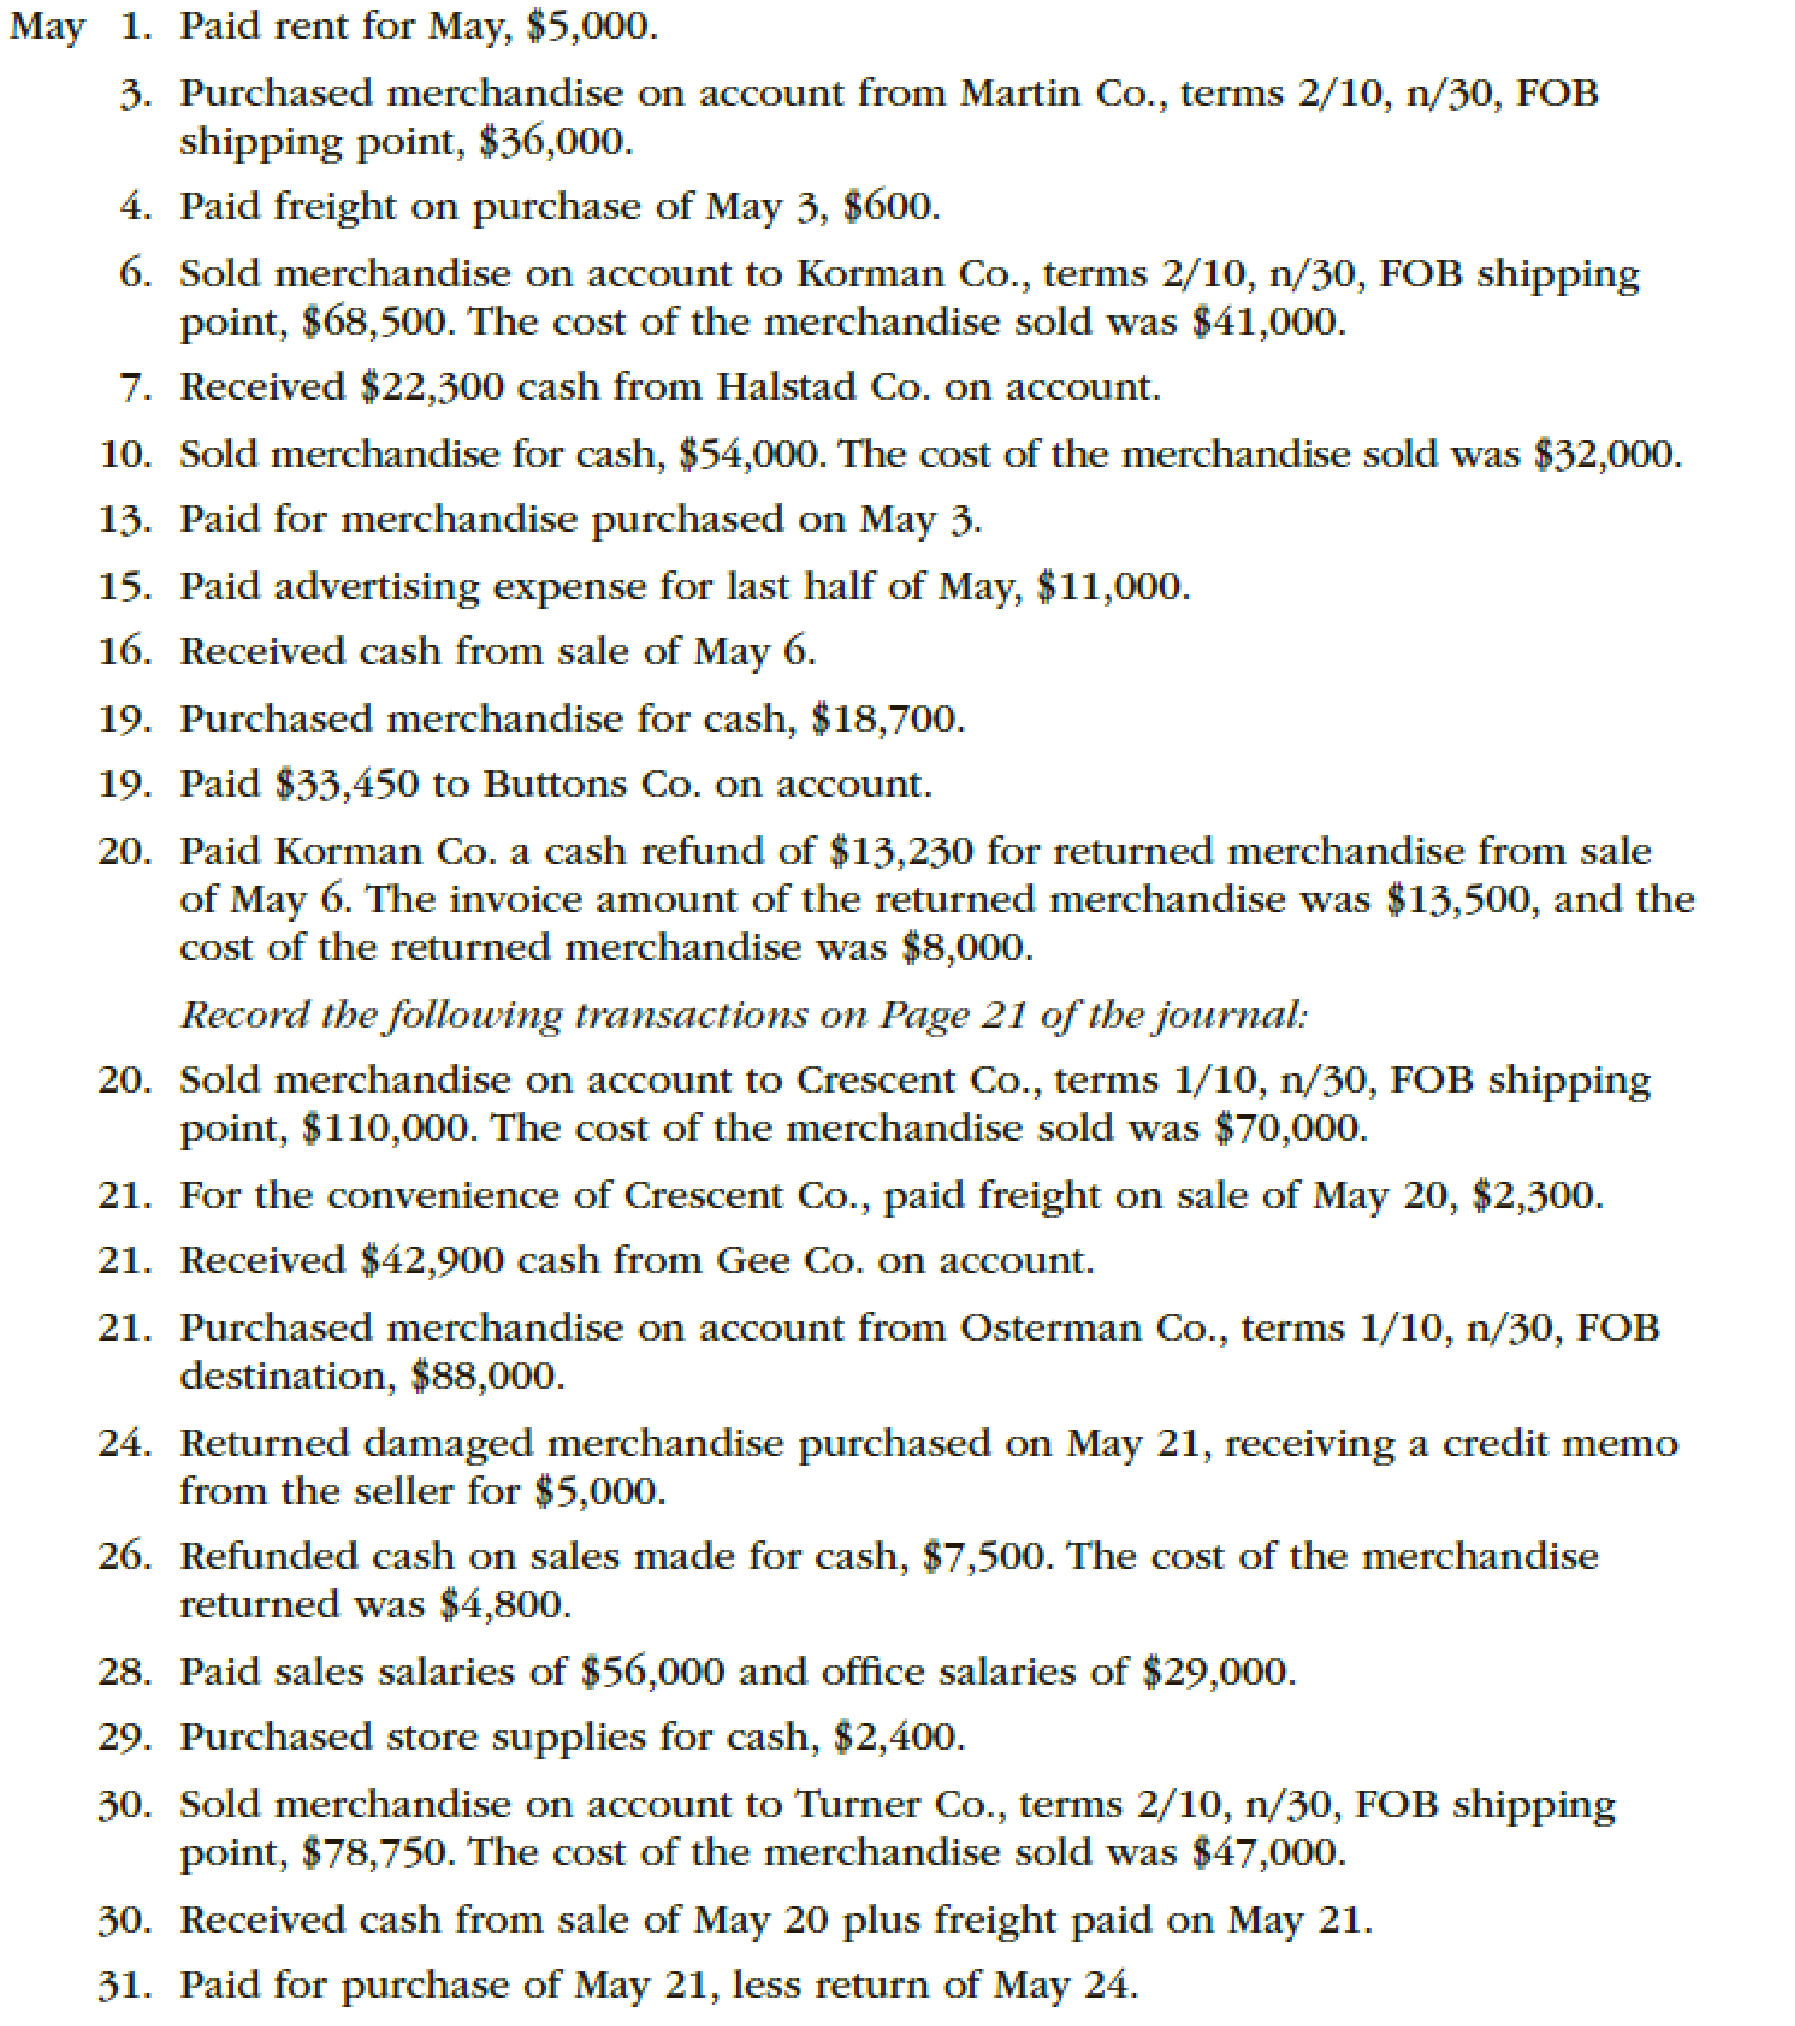
During May, the last month of the fiscal year, the following transactions were completed:
Instructions
- 1. Enter the balances of each of the accounts in the appropriate balance column of a four-column account. Write Balance in the item section and place a check mark (✓) in the Posting Reference column. Journalize the transactions for May, starting on Page 20 of the journal.
- 2. Post the journal to the general ledger, extending the month-end balances to the appropriate balance columns after all posting is completed. In this problem, you are not required to update or post to the
accounts receivable and accounts payable subsidiary ledgers. - 3. Prepare an unadjusted
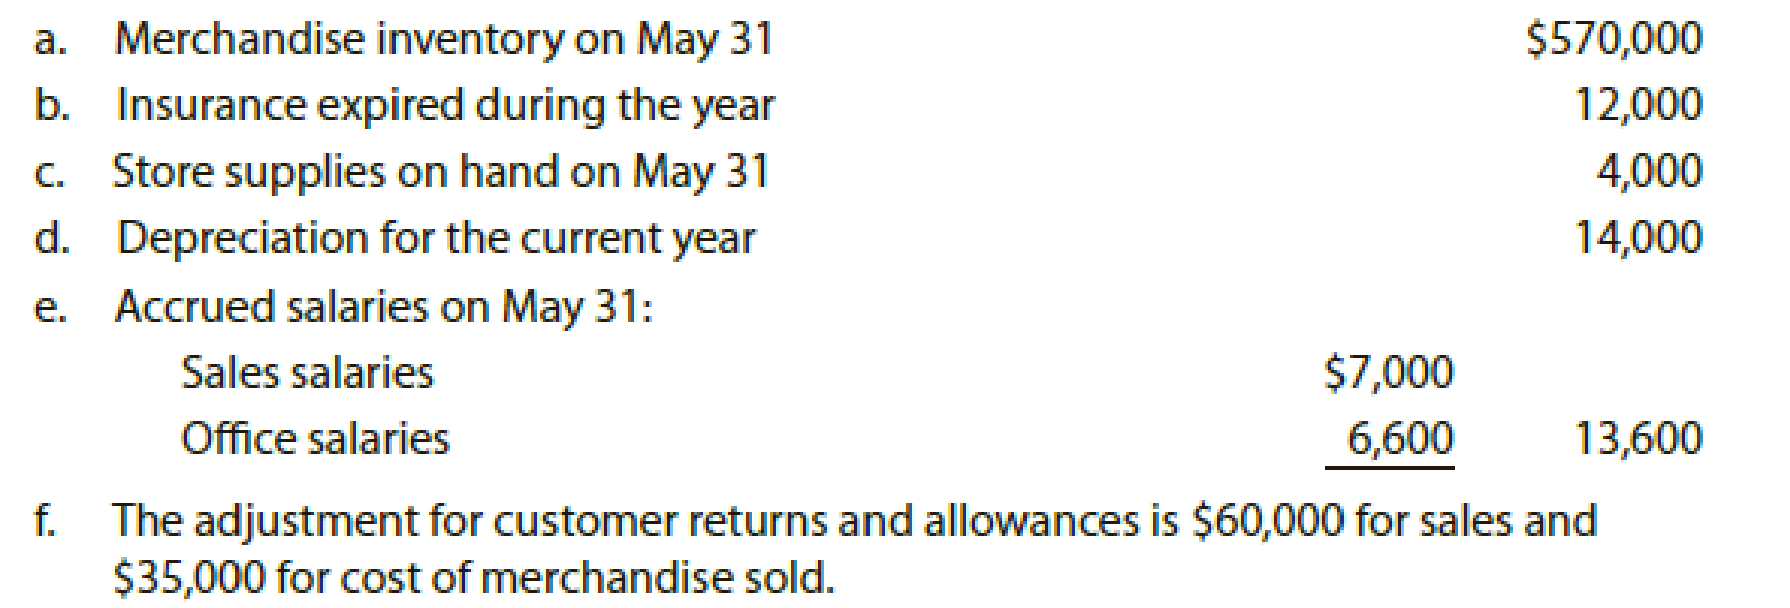
trial balance . - 4. At the end of May, the following adjustment data were assembled. Analyze and use these data to complete (5) and (6).
- 5. (Optional) Enter the unadjusted trial balance on a 10-column end-of-period spreadsheet (work sheet), and complete the spreadsheet.
- 6. Journalize and post the
adjusting entries . Record the adjusting entries on Page 22 of the journal. - 7. Prepare an adjusted trial balance.
- 8. Prepare an income statement, a statement of owner’s equity, and a
balance sheet . - 9. Prepare and
post the closing entries. Record the closing entries on Page 23 of the journal. Indicate closed accounts by inserting a line in both Balance columns opposite the closing entry. Insert the new balance in the owner’s capital account. - 10. Prepare a post-closing trial balance.
1, 2, 6, and 9.
Post the balance of each of the accounts.
Explanation of Solution
Enter the balances of each of the accounts.
Cash Account:
| Cash Account | Account No. 110 | ||||||
| Date | Item |
Post. Ref. | Debit | Credit | Balance ($) | ||
| Debit | Credit | ||||||
| 2018 | |||||||
| May | 1 | Balance | ✓ | 83,600 | |||
| 1 | 20 | 5,000 | |||||
| 4 | 20 | 600 | |||||
| 7 | 20 | 22,300 | |||||
| 10 | 20 | 54,000 | |||||
| 13 | 20 | 35,280 | |||||
| 15 | 20 | 11,000 | |||||
| 16 | 20 | 67,130 | |||||
| 19 | 20 | 18,700 | |||||
| 19 | 20 | 33,450 | |||||
| 20 | 20 | 13,230 | |||||
| 21 | 21 | 2,300 | |||||
| 21 | 21 | 42,900 | |||||
| 26 | 21 | 7,500 | |||||
| 28 | 21 | 85,000 | |||||
| 29 | 21 | 2,400 | |||||
| 30 | 21 | 111,200 | |||||
| 31 | 21 | 82,170 | 84,500 | ||||
Table (1)
Accounts Receivable Account:
| Accounts Receivable | Account No. 112 | ||||||
| Date | Item |
Post. Ref. | Debit | Credit | Balance ($) | ||
| Debit | Credit | ||||||
| 2018 | |||||||
| May | 1 | Balance | ✓ | 233,900 | |||
| 6 | 20 | 67,130 | |||||
| 7 | 20 | 22,300 | |||||
| 16 | 20 | 67,130 | |||||
| 20 | 21 | 108,900 | |||||
| 21 | 21 | 2,300 | |||||
| 21 | 21 | 42,900 | |||||
| 30 | 21 | 77,175 | |||||
| 30 | 21 | 111,200 | 245,875 | ||||
Table (2)
Inventory Account:
| Inventory | Account No. 115 | ||||||
| Date | Item |
Post. Ref. | Debit | Credit | Balance ($) | ||
| Debit | Credit | ||||||
| 2018 | |||||||
| May | 1 | Balance | ✓ | 624,400 | |||
| 3 | 20 | 35,280 | |||||
| 4 | 20 | 600 | |||||
| 6 | 20 | 41,000 | |||||
| 10 | 20 | 32,000 | |||||
| 19 | 20 | 18,700 | |||||
| 20 | 20 | 8,000 | |||||
| 20 | 21 | 70,000 | |||||
| 21 | 21 | 87,120 | |||||
| 24 | 21 | 4,950 | |||||
| 26 | 21 | 4,800 | |||||
| 30 | 21 | 47,000 | 583,950 | ||||
| 31 | Adjusting | 22 | 13,950 | 570,000 | |||
Table (3)
Estimated Returns Inventory Account:
| Estimated Returns Inventory | Account No. 116 | ||||||
| Date | Item |
Post. Ref. | Debit | Credit | Balance ($) | ||
| Debit | Credit | ||||||
| 2018 | |||||||
| May | 1 | Balance | ✓ | 28,000 | |||
| 20 | 20 | 8,000 | |||||
| 26 | 21 | 4,800 | 15,200 | ||||
| 31 | Adjusting | 22 | 35,000 | 50,200 | |||
Table (4)
Prepaid Insurance Account:
| Prepaid Insurance | Account No. 117 | ||||||
| Date | Item |
Post. Ref. | Debit | Credit | Balance ($) | ||
| Debit | Credit | ||||||
| 2018 | |||||||
| May | 1 | Balance | ✓ | 16,800 | |||
| 31 | Adjusting | 22 | 12,000 | 4,800 | |||
Table (5)
Store Supplies Account:
| Store Supplies | Account No. 118 | ||||||
| Date | Item |
Post. Ref. | Debit | Credit | Balance ($) | ||
| Debit | Credit | ||||||
| 2018 | |||||||
| May | 1 | Balance | ✓ | 11,400 | |||
| 29 | 21 | 2,400 | 13,800 | ||||
| 31 | Adjusting | 22 | 9,800 | 4,000 | |||
Table (6)
Store Equipment Account:
| Store Equipment | Account No. 123 | ||||||
| Date | Item |
Post. Ref. | Debit | Credit | Balance ($) | ||
| Debit | Credit | ||||||
| 2018 | |||||||
| May | 1 | Balance | ✓ | 569,500 | |||
Table (7)
Accumulated Depreciation – Store Equipment Account:
| Accumulated Depreciation – Store Equipment | Account No. 124 | ||||||
| Date | Item |
Post. Ref. | Debit | Credit | Balance ($) | ||
| Debit | Credit | ||||||
| 2018 | |||||||
| May | 1 | Balance | ✓ | 56,700 | |||
| 31 | Adjusting | 22 | 14,000 | 70,700 | |||
Table (8)
Accounts Payable Account:
| Accounts Payable | Account No. 210 | ||||||
| Date | Item |
Post. Ref. | Debit | Credit | Balance ($) | ||
| Debit | Credit | ||||||
| 2018 | |||||||
| May | 1 | Balance | ✓ | 96,600 | |||
| 3 | 20 | 35,280 | |||||
| 13 | 20 | 35,280 | |||||
| 19 | 20 | 33,450 | |||||
| 21 | 21 | 87,120 | |||||
| 24 | 21 | 4,950 | |||||
| 31 | 21 | 82,170 | 63,150 | ||||
Table (9)
Salaries Payable Account:
| Salaries Payable | Account No. 211 | ||||||
| Date | Item |
Post. Ref. | Debit | Credit | Balance ($) | ||
| Debit | Credit | ||||||
| 2018 | |||||||
| May | 31 | Adjusting | 22 | 13,600 | 13,600 | ||
Table (10)
Customers Refunds Payable Account:
| Customers Refunds Payable | Account No. 212 | ||||||
| Date | Item |
Post. Ref. | Debit | Credit | Balance ($) | ||
| Debit | Credit | ||||||
| 2018 | |||||||
| May | 1 | Balance | ✓ | 50,000 | |||
| 20 | 20 | 13,230 | |||||
| 26 | 21 | 7,500 | 29,270 | ||||
| 31 | Adjusting | 22 | 60,000 | 89,270 | |||
Table (11)
Common Stock Account:
| Common Stock | Account No. 310 | ||||||
| Date | Item |
Post. Ref. | Debit | Credit | Balance ($) | ||
| Debit | Credit | ||||||
| 2018 | |||||||
| May | 1 | Balance | ✓ | 100,000 | |||
Table (12)
Retained Earnings Account:
| Retained Earnings | Account No. 311 | ||||||
| Date | Item |
Post. Ref. | Debit | Credit | Balance ($) | ||
| Debit | Credit | ||||||
| 2017 | |||||||
| June | 1 | Balance | ✓ | 585,300 | |||
| 2018 | |||||||
| May | 31 | Closing | 23 | 741,855 | |||
| 31 | Closing | 23 | 135,000 | 1,192,155 | |||
Table (13)
Dividends Account:
| Dividends | Account No. 312 | ||||||
| Date | Item |
Post. Ref. | Debit | Credit | Balance ($) | ||
| Debit | Credit | ||||||
| 2018 | |||||||
| May | 1 | Balance | ✓ | 135,000 | |||
| 31 | Closing | 23 | 135,000 | ||||
Table (14)
Income Summary Account:
| Income Summary | Account No. 313 | ||||||
| Date | Item |
Post. Ref. | Debit | Credit | Balance ($) | ||
| Debit | Credit | ||||||
| 2018 | |||||||
| May | 31 | Closing | 23 | 5,316,205 | |||
| 31 | Closing | 23 | 4,574,350 | 741,855 | |||
| 31 | Closing | 23 | 741,855 | ||||
Table (15)
Sales Account:
| Sales | Account No. 410 | ||||||
| Date | Item |
Post. Ref. | Debit | Credit | Balance ($) | ||
| Debit | Credit | ||||||
| 2018 | |||||||
| May | 1 | Balance | ✓ | 5,069,000 | |||
| 6 | 20 | 67,130 | |||||
| 10 | 20 | 54,000 | |||||
| 20 | 21 | 108,900 | |||||
| 30 | 21 | 77,175 | 5,376,205 | ||||
| 31 | Adjusting | 22 | 60,000 | 5,316,205 | |||
| 31 | Closing | 23 | 5,316,205 | ||||
Table (16)
Cost of Goods Sold Account:
| Cost of Goods Sold | Account No. 510 | ||||||
| Date | Item |
Post. Ref. | Debit | Credit | Balance ($) | ||
| Debit | Credit | ||||||
| 2018 | |||||||
| May | 1 | Balance | ✓ | 2,823,000 | |||
| 6 | 20 | 41,000 | |||||
| 10 | 20 | 32,000 | |||||
| 20 | 21 | 70,000 | |||||
| 30 | 21 | 47,000 | 3,013,000 | ||||
| 31 | Adjusting | 22 | 13,950 | ||||
| 31 | Adjusting | 22 | 35,000 | 2,991,950 | |||
| 31 | Closing | 23 | 2,991,950 | ||||
Table (17)
Sales Salaries Expense Account:
| Sales Salaries Expense | Account No. 520 | ||||||
| Date | Item |
Post. Ref. | Debit | Credit | Balance ($) | ||
| Debit | Credit | ||||||
| 2018 | |||||||
| May | 1 | Balance | ✓ | 664,800 | |||
| 28 | 21 | 56,000 | 720,800 | ||||
| 31 | Adjusting | 22 | 7,000 | 727,800 | |||
| 31 | Closing | 23 | 727,800 | ||||
Table (18)
Advertising Expense Account:
| Advertising Expense | Account No. 521 | ||||||
| Date | Item |
Post. Ref. | Debit | Credit | Balance ($) | ||
| Debit | Credit | ||||||
| 2018 | |||||||
| May | 1 | Balance | ✓ | 281,000 | |||
| 15 | 20 | 11,000 | 292,000 | ||||
| 31 | Closing | 23 | 292,000 | ||||
Table (19)
Depreciation Expense Account:
| Depreciation Expense | Account No. 522 | ||||||
| Date | Item |
Post. Ref. | Debit | Credit | Balance ($) | ||
| Debit | Credit | ||||||
| 2018 | |||||||
| May | 31 | Adjusting | 22 | 14,000 | 14,000 | ||
| 31 | Closing | 23 | 14,000 | ||||
Table (20)
Stores Supplies Expense Account:
| Stores Supplies Expense | Account No. 523 | ||||||
| Date | Item |
Post. Ref. | Debit | Credit | Balance ($) | ||
| Debit | Credit | ||||||
| 2018 | |||||||
| May | 31 | Adjusting | 22 | 9,800 | 9,800 | ||
| 31 | Closing | 23 | 9,800 | ||||
Table (21)
Miscellaneous Selling Expense Account:
| Miscellaneous Selling Expense | Account No. 529 | ||||||
| Date | Item |
Post. Ref. | Debit | Credit | Balance ($) | ||
| Debit | Credit | ||||||
| 2018 | |||||||
| May | 1 | Balance | ✓ | 12,600 | |||
| 31 | Closing | 23 | 12,600 | ||||
Table (22)
Office Salaries Expense Account:
| Office Salaries Expense | Account No. 530 | ||||||
| Date | Item |
Post. Ref. | Debit | Credit | Balance ($) | ||
| Debit | Credit | ||||||
| 2018 | |||||||
| May | 1 | Balance | ✓ | 382,100 | |||
| 28 | 21 | 29,000 | 411,100 | ||||
| 31 | Adjusting | 22 | 6,600 | 417,700 | |||
| 31 | Closing | 23 | 417,700 | ||||
Table (23)
Rent Expense Account:
| Rent Expense | Account No. 531 | ||||||
| Date | Item |
Post. Ref. | Debit | Credit | Balance ($) | ||
| Debit | Credit | ||||||
| 2018 | |||||||
| May | 1 | Balance | ✓ | 83,700 | |||
| 1 | 20 | 5,000 | 88,700 | ||||
| 31 | Closing | 23 | 88,700 | ||||
Table (24)
Insurance Expense Account:
| Insurance Expense | Account No. 532 | ||||||
| Date | Item |
Post. Ref. | Debit | Credit | Balance ($) | ||
| Debit | Credit | ||||||
| 2018 | |||||||
| May | 31 | Adjusting | 22 | 12,000 | 12,000 | ||
| 31 | Closing | 23 | 12,000 | ||||
Table (25)
Miscellaneous Administrative Expense Account:
| Miscellaneous Administrative Expense | Account No. 539 | ||||||
| Date | Item |
Post. Ref. | Debit | Credit | Balance ($) | ||
| Debit | Credit | ||||||
| 2018 | |||||||
| May | 1 | Balance | ✓ | 7,800 | |||
| 31 | Closing | 23 | 7,800 | ||||
Table (26)
1. And 2.
Record the journal entries.
Explanation of Solution
| Date | Particulars | Post. Ref. | Page 20 | ||
| Debit ($) | Credit ($) | ||||
| 2018 | |||||
| May | 1 | Rent Expense | 531 | 5,000 | |
| Cash | 110 | 5,000 | |||
| 3 | Inventory | 115 | 35,280 | ||
| Accounts Payable | 210 | 35,280 | |||
| 4 | Inventory | 115 | 600 | ||
| Cash | 110 | 600 | |||
| 6 | Accounts Receivable | 112 | 67,130 | ||
| Sales | 410 | 67,130 | |||
| 6 | Cost of Goods Sold | 510 | 41,000 | ||
| Inventory | 115 | 41,000 | |||
| 7 | Cash | 110 | 22,300 | ||
| Accounts Receivable | 112 | 22,300 | |||
| 10 | Cash | 110 | 54,000 | ||
| Sales | 410 | 54,000 | |||
| 10 | Cost of Goods Sold | 510 | 32,000 | ||
| Inventory | 115 | 32,000 | |||
| 13 | Accounts Payable | 210 | 35,280 | ||
| Cash | 110 | 35,280 | |||
| 15 | Advertising Expense | 521 | 11,000 | ||
| Cash | 110 | 11,000 | |||
| 16 | Cash | 110 | 67,130 | ||
| Accounts Receivable | 112 | 67,130 | |||
| 19 | Inventory | 115 | 18,700 | ||
| Cash | 110 | 18,700 | |||
| 19 | Accounts Payable | 210 | 33,450 | ||
| Cash | 110 | 33,450 | |||
| 20 | Customers Refunds Payable | 212 | 13,230 | ||
| Cash | 110 | 13,230 | |||
| 20 | Inventory | 115 | 8,000 | ||
| Estimated Returns Inventory | 116 | 8,000 | |||
| Date | Particulars | Post. Ref. | Page 21 | ||
| Debit ($) | Credit ($) | ||||
| 20 | Accounts Receivable | 112 | 108,900 | ||
| Sales | 410 | 108,900 | |||
| 20 | Cost of Goods Sold | 510 | 70,000 | ||
| Inventory | 115 | 70,000 | |||
| 21 | Accounts Receivable | 112 | 2,300 | ||
| Cash | 110 | 2,300 | |||
| 21 | Cash | 110 | 42,900 | ||
| Accounts Receivable | 112 | 42,900 | |||
| 21 | Inventory | 115 | 87,120 | ||
| Accounts Payable | 210 | 87,120 | |||
| 24 | Accounts Payable | 210 | 4,950 | ||
| Inventory | 115 | 4,950 | |||
| 26 | Customers Refunds Payable | 212 | 7,500 | ||
| Cash | 110 | 7,500 | |||
| 26 | Inventory | 115 | 4,800 | ||
| Estimated Returns Inventory | 116 | 4,800 | |||
| 28 | Sales Salaries Expense | 520 | 56,000 | ||
| Office Salaries Expense | 530 | 29,000 | |||
| Cash | 110 | 85,000 | |||
| 29 | Store Supplies | 118 | 2,400 | ||
| Cash | 110 | 2,400 | |||
| 30 | Accounts Receivable | 112 | 77,175 | ||
| Sales | 410 | 77,175 | |||
| 30 | Cost of Goods Sold | 510 | 47,000 | ||
| Inventory | 115 | 47,000 | |||
| 30 | Cash | 110 | 111,200 | ||
| Accounts Receivable | 112 | 111,200 | |||
| 31 | Accounts Payable | 210 | 82,170 | ||
| Cash | 110 | 82,170 | |||
Table (27)
3.
Prepare the unadjusted trial balance of Company P.
Explanation of Solution
Prepare an unadjusted trial balance.
|
P Company Unadjusted Trial Balance As on May 31, 2018 | |||
| Accounts |
Account No. |
Debit Balances ($) |
Credit Balances ($) |
| Cash | 110 | 84,500 | |
| Accounts Receivable | 112 | 245,875 | |
| Inventory | 115 | 583,950 | |
| Estimated Returns Inventory | 116 | 15,200 | |
| Prepaid Insurance | 117 | 16,800 | |
| Store Supplies | 118 | 13,800 | |
| Store Equipment | 123 | 569,500 | |
| Accumulated Depreciation—Store Equipment | 124 | 56,700 | |
| Accounts Payable | 210 | 63,150 | |
| Salaries Payable | 211 | — | |
| Customers Refunds Payable | 212 | 29,270 | |
| Common Stock | 310 | 100,000 | |
| Retained Earnings | 311 | 585,300 | |
| Dividends | 312 | 135,000 | |
| Sales | 410 | 5,376,205 | |
| Cost of Goods Sold | 510 | 3,013,000 | |
| Sales Salaries Expense | 520 | 720,800 | |
| Advertising Expense | 521 | 292,000 | |
| Depreciation Expense | 522 | — | |
| Store Supplies Expense | 523 | — | |
| Miscellaneous Selling Expense | 529 | 12,600 | |
| Office Salaries Expense | 530 | 411,100 | |
| Rent Expense | 531 | 88,700 | |
| Insurance Expense | 532 | — | |
| Miscellaneous Administrative Expense | 539 | 7,800 | |
| Total | 6,210,625 | 6,210,625 | |
Table (28)
4. and 6.
Record the adjusting entry.
Explanation of Solution
| Date | Particulars |
Post. Ref. | Page 22 | ||
| Debit ($) | Credit ($) | ||||
| 2018 | Adjusting Entries | ||||
| May | 31 | Cost of Goods Sold | 510 | 13,950 | |
| Inventory | 115 | 13,950 | |||
| 31 | Insurance Expense | 532 | 12,000 | ||
| Prepaid Insurance | 117 | 12,000 | |||
| 31 | Store Supplies Expense | 523 | 9,800 | ||
| Store Supplies | 118 | 9,800 | |||
| 31 | Depreciation Expense | 522 | 14,000 | ||
|
Accumulated. Depreciation —Store Equipment | 124 | 14,000 | |||
| 31 | Sales Salaries Expense | 520 | 7,000 | ||
| Office Salaries Expense | 530 | 6,600 | |||
| Salaries Payable | 211 | 13,600 | |||
| 31 | Sales | 410 | 60,000 | ||
| Customer Refunds Payable | 212 | 60,000 | |||
| 31 | Estimated Returns Inventory | 116 | 35,000 | ||
| Cost of Goods Sold | 510 | 35,000 | |||
Table (29)
7.
Prepare the adjusted trial balance of Company P.
Explanation of Solution
Prepare the adjusted trial balance.
|
P Company Adjusted Trial Balance As on May 31, 2018 | |||
| Particulars |
Account No. |
Debit Balances ($) |
Credit Balances ($) |
| Cash | 110 | 84,500 | |
| Accounts Receivable | 112 | 245,875 | |
| Inventory | 115 | 570,000 | |
| Estimated Returns Inventory | 116 | 50,200 | |
| Prepaid Insurance | 117 | 4,800 | |
| Store Supplies | 118 | 4,000 | |
| Store Equipment | 123 | 569,500 | |
| Accumulated Depreciation—Store Equipment | 124 | 70,700 | |
| Accounts Payable | 210 | 63,150 | |
| Salaries Payable | 211 | 13,600 | |
| Customers Refunds Payable | 212 | 89,270 | |
| Common Stock | 310 | 100,000 | |
| Retained Earnings | 311 | 585,300 | |
| Dividends | 312 | 135,000 | |
| Sales | 410 | 5,316,205 | |
| Cost of Goods Sold | 510 | 2,991,950 | |
| Sales Salaries Expense | 520 | 727,800 | |
| Advertising Expense | 521 | 292,000 | |
| Depreciation Expense | 522 | 14,000 | |
| Store Supplies Expense | 523 | 9,800 | |
| Miscellaneous Selling Expense | 529 | 12,600 | |
| Office Salaries Expense | 530 | 417,700 | |
| Rent Expense | 531 | 88,700 | |
| Insurance Expense | 532 | 12,000 | |
| Miscellaneous Administrative Expense | 539 | 7,800 | |
| Total | 6,238,225 | 6,238,225 | |
Table (30)
8.
Prepare the income statement, retained earnings, and balance sheet of P Company.
Explanation of Solution
Prepare the income statement.
|
P Company Income Statement For the Year Ended May 31, 2018 | |||
| Particulars | Amount ($) | Amount ($) | Amount ($) |
| Sales | 5,316,205 | ||
| Cost of goods sold | (2,991,950) | ||
| Gross profit | 2,324,255 | ||
| Expenses: | |||
| Selling expenses: | |||
| Sales salaries expense | 727,800 | ||
| Advertising expense | 292,000 | ||
| Depreciation expense | 14,000 | ||
| Store supplies expense | 9,800 | ||
| Miscellaneous selling expense | 12,600 | ||
| Total selling expenses | 1,056,200 | ||
| Administrative expenses: | |||
| Office salaries expense | 417,700 | ||
| Rent expense | 88,700 | ||
| Insurance expense | 12,000 | ||
| Miscellaneous administrative expense | 7,800 | ||
| Total administrative expenses | 526,200 | ||
| Total expenses | (1,582,400) | ||
| Net income | 741,855 | ||
Table (31)
Prepare the retained earnings statement.
|
P Company Retained Earnings Statement For the Year Ended May 31, 2018 | ||
| Retained earnings, June 1, 2017 | 585,300 | |
| Net income | 741,855 | |
| Dividends | (135,000) | |
| Change in retained earnings | 606,855 | |
| Retained earnings, May 31, 2018 | 1,192,155 | |
Table (32)
Prepare the balance sheet of P Company.
|
P Company Balance Sheet As on May 31, 2018 | ||
| Assets | Amount ($) | Amount ($) |
| Current assets: | ||
| Cash | $ 84,500 | |
| Accounts receivable | 245,875 | |
| Inventory | 570,000 | |
| Estimated returns inventory | 50,200 | |
| Prepaid insurance | 4,800 | |
| Store supplies | 4,000 | |
| Total current assets | $ 959,375 | |
| Property, plant, and equipment: | ||
| Store equipment | $ 569,500 | |
| Accumulated depreciation—store equipment | (70,700) | |
| Total property, plant, and equipment | 498,800 | |
| Total assets | $1,458,175 | |
| Liabilities | ||
| Current liabilities: | ||
| Accounts payable | $ 63,150 | |
| Salaries payable | 13,600 | |
| Customers refunds payable | 89,270 | |
| Total liabilities | $ 166,020 | |
| Stockholders’ Equity | ||
| Common stock | $ 100,000 | |
| Retained earnings | 1,192,155 | |
| Total stockholders’ equity | 1,292,155 | |
| Total liabilities and stockholders’ equity | $1,458,175 | |
Table (33)
9.
Prepare the closing entries.
Explanation of Solution
Prepare the closing entries.
| Date | Particulars |
Post. Ref. | Page 23 | ||
| Debit ($) | Credit ($) | ||||
| 2018 | Closing Entries | ||||
| May | 31 | Sales | 410 | 5,316,205 | |
| Income Summary | 313 | 5,316,205 | |||
| 31 | Income Summary | 313 | 4,574,350 | ||
| Cost of Goods Sold | 510 | 2,991,950 | |||
| Sales Salaries Expense | 520 | 727,800 | |||
| Advertising Expense | 521 | 292,000 | |||
| Depreciation Expense | 522 | 14,000 | |||
| Store Supplies Expense | 523 | 9,800 | |||
| Miscellaneous Selling Expense | 529 | 12,600 | |||
| Office Salaries Expense | 530 | 417,700 | |||
| Rent Expense | 531 | 88,700 | |||
| Insurance Expense | 532 | 12,000 | |||
| Miscellaneous Administrative Expenses | 539 | 7,800 | |||
| 31 | Income Summary | 313 | 741,855 | ||
| Retained Earnings | 311 | 741,855 | |||
| 31 | Retained Earnings | 311 | 135,000 | ||
| Dividends | 312 | 135,000 | |||
Table (34)
10.
Prepare the post-closing trial balance.
Explanation of Solution
Prepare the post-closing trial balance.
|
P Company Post-Closing Trial Balance May 31, 2018 | |||
| Accounts |
Account No. |
Debit Balances ($) |
Credit Balances ($) |
| Cash | 110 | 84,500 | |
| Accounts Receivable | 112 | 245,875 | |
| Inventory | 115 | 570,000 | |
| Estimated Returns Inventory | 116 | 50,200 | |
| Prepaid Insurance | 117 | 4,800 | |
| Store Supplies | 118 | 4,000 | |
| Store Equipment | 123 | 569,500 | |
| Accumulated Depreciation—Store Equipment | 124 | 70,700 | |
| Accounts Payable | 210 | 63,150 | |
| Salaries Payable | 211 | 13,600 | |
| Customers Refunds Payable | 212 | 89,270 | |
| Common Stock | 310 | 100,000 | |
| Retained Earnings | 311 | 1,192,155 | |
| Total | 1,528,875 | 1,528,875 | |
Table (35)
5.
Prepare the worksheet for Company P.
Explanation of Solution
Prepare the worksheet.
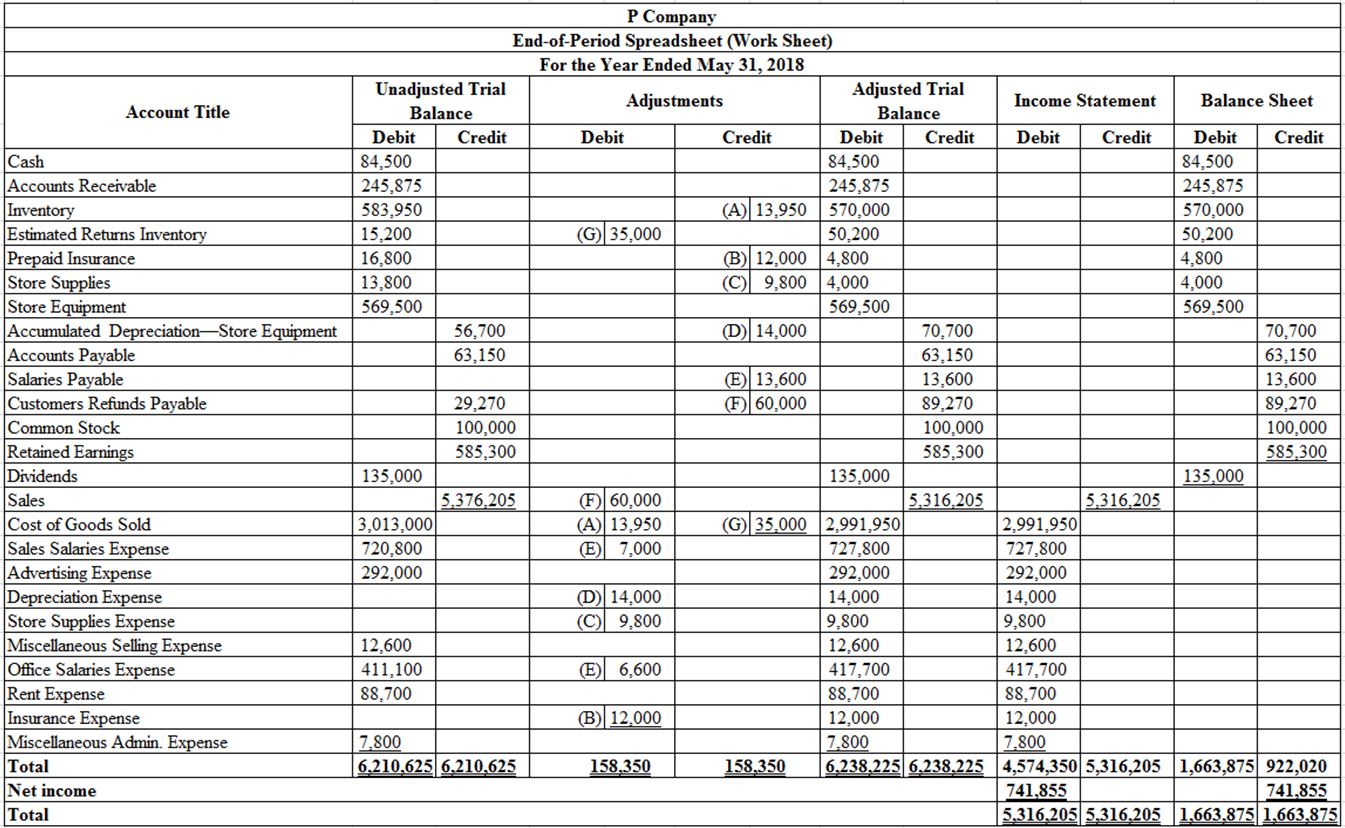
Figure (1)
Want to see more full solutions like this?
Chapter 6 Solutions
Cengagenowv2, 1 Term Printed Access Card For Warren/reeve/duchac's Financial Accounting, 15th


- Can you help me solve this general accounting problem using the correct accounting process?arrow_forwardCan you help me solve this financial accounting problem using the correct accounting process?arrow_forwardLast year Kellner Corporation reported cost of goods sold of $180,000. Inventories decreased by $15,000 during the year, and accounts payable increased by $8,000. The company uses the direct method to determine the net cash flows from operating activities on the statement of cash flows. The cost of goods sold adjusted to a cash basis would be: a. $203,000 b. $157,000 c. $165,000 d. $172,000arrow_forward
- I need help solving this financial accounting question with the proper methodology.arrow_forwardPlease provide the correct answer to this financial accounting problem using accurate calculations.arrow_forwardPlease provide the correct answer to this general accounting problem using valid calculations.arrow_forward
 Financial AccountingAccountingISBN:9781337272124Author:Carl Warren, James M. Reeve, Jonathan DuchacPublisher:Cengage Learning
 Financial And Managerial AccountingAccountingISBN:9781337902663Author:WARREN, Carl S.Publisher:Cengage Learning,
 Financial AccountingAccountingISBN:9781305088436Author:Carl Warren, Jim Reeve, Jonathan DuchacPublisher:Cengage Learning
 College Accounting (Book Only): A Career ApproachAccountingISBN:9781337280570Author:Scott, Cathy J.Publisher:South-Western College Pub
 College Accounting (Book Only): A Career ApproachAccountingISBN:9781305084087Author:Cathy J. ScottPublisher:Cengage Learning