Videos
In Problems 1–3, set up definite
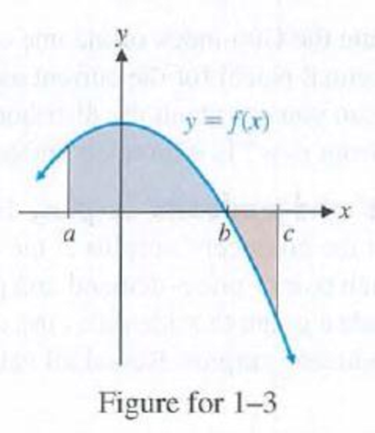
1. Interval [a, b]
The definite integral that represents the indicated shaded area.
Answer to Problem 1RE
The definite integral
Explanation of Solution
Theorem used:
If f and g are continuous and
Calculation:
The given function is
From the given figure, it is observed that the indicated area is bounded by the graph of the function
Also, it is noted that the function
By the above mentioned theorem, the area of the shaded region can be computed by the definite integral
Thus, the definite integral
Want to see more full solutions like this?
Chapter 6 Solutions
Pearson eText for Calculus for Business, Economics, Life Sciences, and Social Sciences, Brief Version -- Instant Access (Pearson+)


- DATA TABLE VALUES Meal Price ($) 22.78 31.90 33.89 22.77 18.04 23.29 35.28 42.38 36.88 38.55 41.68 25.73 34.19 31.75 25.24 26.32 19.57 36.57 32.97 36.83 30.17 37.29 25.37 24.71 28.79 32.83 43.00 35.23 34.76 33.06 27.73 31.89 38.47 39.42 40.72 43.92 36.51 45.25 33.51 29.17 30.54 26.74 37.93arrow_forwardI need help with this problem and an explanation of the solution for the image described below. (Statistics: Engineering Probabilities)arrow_forwardQuestion 4 Find an equation of (a) The plane through the point (2, 0, 1) and perpendicular to the line x = y=2-t, z=3+4t. 3t, (b) The plane through the point (3, −2, 8) and parallel to the plane z = x+y. (c) The plane that contains the line x = 1+t, y = 2 − t, z = 4 - 3t and is parallel to the plane 5x + 2y + z = 1. (d) The plane that passes through the point (1,2,3) and contains the line x = 3t, y = 1+t, and z = 2-t. (e) The plane that contains the lines L₁: x = 1 + t, y = 1 − t, z = 2t and L2 : x = 2 − s, y = s, z = 2.arrow_forward
- Please find all values of x.arrow_forwardSales personnel for Skillings Distributors submit weekly reports listing the customer contacts made during the week. A sample of 65 weekly reports showed a sample mean of 19.5 customer contacts per week. The sample standard deviation was 5.2. Provide 90% and 95% confidence intervals for the population mean number of weekly customer contacts for the sales personnel. 90% Confidence interval, to 2 decimals: ( , ) 95% Confidence interval, to 2 decimals:arrow_forwardA simple random sample of 40 items resulted in a sample mean of 25. The population standard deviation is 5. a. What is the standard error of the mean (to 2 decimals)? b. At 95% confidence, what is the margin of error (to 2 decimals)?arrow_forward
- mean trough level of the population to be 3.7 micrograms/mL. The researcher conducts a study among 93 newly diagnosed arthritis patients and finds the mean trough to be 4.1 micrograms/mL with a standard deviation of 2.4 micrograms/mL. The researcher wants to test at the 5% level of significance if the trough is different than previously reported or not. Z statistics will be used. Complete Step 5 of hypothesis testing: Conclusion. State whether or not you would reject the null hypothesis and why. Also interpret what this means (i.e. is the mean trough different from 3.7 or noarrow_forwardQ15arrow_forwardMathematical Statistics: I ended up having 2.306 as my t-distrubtion but I'm not sure how to find the length.arrow_forward
 Discrete Mathematics and Its Applications ( 8th I...MathISBN:9781259676512Author:Kenneth H RosenPublisher:McGraw-Hill Education
 Mathematics for Elementary Teachers with Activiti...MathISBN:9780134392790Author:Beckmann, SybillaPublisher:PEARSON
 Thinking Mathematically (7th Edition)MathISBN:9780134683713Author:Robert F. BlitzerPublisher:PEARSON
 Discrete Mathematics With ApplicationsMathISBN:9781337694193Author:EPP, Susanna S.Publisher:Cengage Learning,
 Pathways To Math Literacy (looseleaf)MathISBN:9781259985607Author:David Sobecki Professor, Brian A. MercerPublisher:McGraw-Hill Education