
Videos
In addition to the key words, you should also be able to define each of the following terms:
descriptive research strategy
linear relationship
curvilinear relationship
positive relationship
correlational research strategy
experimental research strategy
quasi-experimental research strategy
nonexperimental research strategy
selection bias
volunteer bias
novelty effect
multiple treatment interference
sensitization, or assessment sensitization, or pretest
sensitization
participant variables
time-related variables
fatigue
practice
artifact
experimenter bias
single-blind
double-blind
demand characteristics
reactivity
laboratory
field
To define:
The following terms:
- Descriptive Research Strategy
- Linear relationship
- Curvilinear Relationship
- Positive Relationship
- Negative Relationship
- Correlational Research Strategy
- Experimental Research Strategy
- Quasi-Experimental Research Strategy
- Non-Experimental Research Strategy
- Selection Bias
- Volunteer Bias
- Novelty Effect
- Multiple Treatment Interference
- Sensitization/Assessment Sensitization/ Pretest Sensitization
- Participant Variable
- Time-Related Variable
- Fatigue
- Practice
- Artifact
- Experimenter Bias
- Single-Blind
- Double-Blind
- Demand Characteristics
- Reactivity
- Laboratory
- Field
Explanation of Solution
Descriptive Research Strategy:
This strategy gives the description of single variable, that is, how it is varying according to time or situation. In other words, one can say that this is a strategy which is used in research to describe the variables. This strategy is used to know the behaviour of any variable and does not work for the causes behind the variation in it.
Linear relationship:
A linear relationship between any two variables can be defined as the relationship which can be represented by a line on a graph. Mathematically, a relationship between the variables x and y which satisfies the equation-
Where m is a slope and c represents intercept.
Curvilinear Relationship:
If the linear relationship does not exist between two variables then there would be another relationship, known as a curvilinear relationship, that is, the relationship except the linear relationship between the two variables is known as curvilinear relationship.
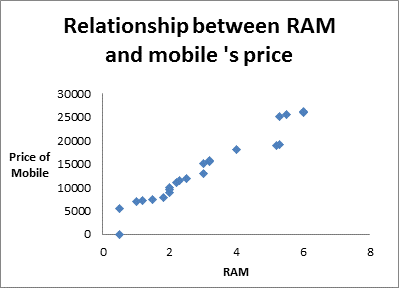
Positive Relationship:
In statistics, a positive relationship or positive correlation is defined as the relationship between two variables in which, increment (decrement) in one variable results in increment(decrement) of other variable (not necessarily in same ratio). In other words, positive relationship is the relationship between the two variables in which both variable moves in same direction.
For example, increment in RAM results in increment in price of mobile. The positive relationship can also be seen graphically through scatter plot.
Negative Relationship:
In statistical terms, a negative relationship or negative correlation is defined as the relationship between two variables in which both the variables move in opposite direction, that is, increment(decrement) in the value of one variable results in decrement (increment) of other.
For example, on increasing the temperature of microwave, the time taken by water to boil is decreased.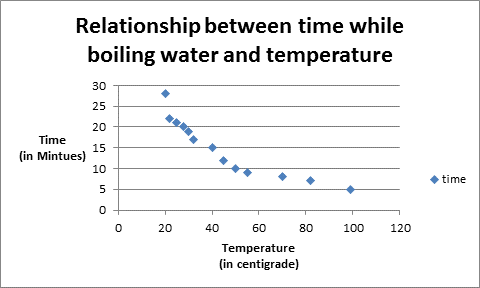
Correlational Research Strategy:
The research strategy used to find the relationship between two variables is known as correlational research strategy. It tells whether the relationship exists or not and if exists then which kind of relationship exists, that is, the nature of relationship. It can be seen by scatter plot which is a graphical representation of variables. Correlation is not same as causation.
Experimental Research Strategy:
The research study which gives the cause and effect relationship between the two variables is known as experimental research strategy. In this type of study, one does changes in a variable which is known as independent variable and the dependent variable is measured at different levels of the independent variable and the remaining variables are known as extraneous variables. Here, manipulation in independent variable is used to determine the direction of a relationship and comparison of dependent variable is done at each level of treatment and one controls the effect of extraneous variables as much as possible through randomization technique.
Quasi-Experimental Research Strategy:
A quasi-experimental research strategy is not a true experimental research strategy but it is between correlational and experimental research strategy. In this strategy, the problem of controlling extraneous variable is not eliminated but the problem of directionality is solved. In this, participants are not randomly assigned to experimental groups.
Non-Experimental Research Strategy:
A research strategy in which independent variable cannot be manipulated or random assignment is not possible is known as non-experimental research strategy. In this type of study, sometimes one has to deal with a problem of single variable or the problem of non causal relationship between variables or the problem may be about a particular experience. Some kinds of non-experimental research are correlational research, quasi-experimental research, single-variable research and qualitative research.
Selection Bias:
As the name 'selection bias' sounds that it is the bias in selection, that is, when the selection of units is not done randomly then it is not a good representative of population and it affects the analysis. So, the main purpose of analysis is not fulfilled when the units in the sample are not chosen randomly. For example, sometimes in interviews, the interviewer do bias in selecting candidates.
Volunteer Bias:
A volunteer bias occurs when the when sample members are self-selected. For example, if teacher asks to students to participate in sports event, then some of the students come to teacher and tell that they want to participate in sports event then they are volunteers and here randomization does not play any role so this type of bias is known as selection bias.
Novelty Effect:
Novelty effect arises due to something new which means that when there is an effect of any new thing occurs or changes in environment then people get boosted for some time and there will be novelty effect. For example, when the online shopping apps came into our lives then suddenly people love to use those apps because of saving of time and some other reasons. The people got attract to online shopping and this was the change for them. So, here the novelty effect kicked in.
Multiple Treatment Interference:
When the multiple treatments are given to the same subjects and effect of one treatment may be influenced by other treatment, this process is known as multiple treatment interference.
Sensitization/Assessment Sensitization/ Pretest Sensitization:
Sensitization is the process of making someone react to something that previously had no effect or in other words, the process of being sensitive towards any specific event.
When the participants involved in the experiment are pretested then there is a risk that they will be sensitive towards the variables which is measured by pretesting and that will affect their post-test scores, this is pretest sensitization.
Participant Variable:
Participant variables are the extraneous variables which describe the individual's characteristics that may impact how he or she responds such as age, anxiety, awareness or intelligence etc. These are known as extraneous variables because these variables can affect the experiment but the experimenter may not consider it.
Time-Related Variable:
It is clear by the name 'time-related variable' that the variables which varies with the time such as price of mobiles, temperature over a day etc. These types of variables are very useful in time-series analysis and in research study too.
Fatigue:
Fatigue means extreme tiredness which occurs without taking rest over a period of time whether from physical or mental illness. Fatigue is a process that has a degree of randomness and is influenced by variety of factors. The most common distributions in data analysis which works against fatigue are Weibull distribution, lognormal distribution and extreme value distribution.
Practice:
It is a threat to internal validity that occurs when prior participation in a measurement provides additional skills that influence their performance on subsequent measurements.
Artifact:
In statistics, artifact is a noise or error which occurs during data manipulation or in the case of selection of faulty choice of variables. It threats the validity of measurement and is an external factor.
Experimenter Bias:
During an experiment, the thoughts of a researcher affect the experiment and it can occur at any phase of research. This is known as experimenter bias. It is very difficult to leave subjectivity completely for anyone because of which this bias arises.
Single-Blind:
When a researcher gives any treatment or medication to a subject and that subject is not aware about the treatment or medication which he/she is receiving is known as single-blind study.
Double-Blind:
When a subject as well as researcher is not aware of the treatment then the study is called as double-blind study. This type of study is used to remove the bias by keeping both the persons unaware about what is being tested.
Demand Characteristics:
In research, demand characteristics are artifact which occurs when the subject is aware about the treatment which they are receiving and then they change their behaviour which affects the outcome of the research.
Reactivity:
Reactivity refers to the behaviour of subject which changes during the experiment when they get affected by any instrument during experiment and this may create bias.
Laboratory:
Laboratory term refers to observing the behaviour of the subject that is observed in controlled atmosphere. For example, a teacher can observe a student in a classroom which is controlled atmosphere and also in playground during holidays which is an uncontrolled atmosphere. So, as a teacher, she/he can get nearly accurate result about student in a class.
Field:
In statistics, field can be defined as the place from where one can collect primary data by using various methods such as personal interview, direct investigation etc.
Want to see more full solutions like this?
Chapter 6 Solutions
EBK RESEARCH METHODS FOR THE BEHAVIORAL


- TIP the aren't, the data are not sym 11 Suppose that the average salary at a certain company is $100,000, and the median salary is $40,000. a. What do these figures tell you about the shape of the histogram of salaries at this company? b. Which measure of center is more appro- priate here? c. Suppose that the company goes through a salary negotiation. How can people on each side use these summary statistics to their advantage? 6360 be 52 PART 1 Getting Off to a Statistically Significant Sarrow_forward12 Suppose that you know that a data set is skewed left, and you know that the two measures of center are 19 and 38. Which figure is the mean and which is the median?arrow_forwardy of 45 home- televisions u find that 010020 le own one, ee, and 1 owns y histogram of 4 Suppose that you have a loaded die. You roll it several times and record the outcomes, which are shown in the following figure. Histogram for Loaded Die 444% 34.00 48% 6% 2% Frequency 20 20 15 155 10 5- ம 0 1 2 3 4 Outcome 5 6 a. Make a relative frequency histogram of these results. b. You can make a relative frequency histo- gram from a frequency histogram; can you go the other direction?arrow_forward
- Calculate the mean for Study Hours and Test Scores. Compute the covariance between the two variables using the formula: Calculate the standard deviation for Study Hours (X) and Test Scores (Y). Determine the correlation coefficient Interpret the results: What does the calculated r-value indicate about the relationship between study hours and test scores?arrow_forwardFor unemployed persons in the United States, the average number of months of unemployment at the end of December 2009 was approximately seven months (Bureau of Labor Statistics, January 2010). Suppose the following data are for a particular region in upstate New York. The values in the first column show the number of months unemployed and the values in the second column show the corresponding number of unemployed persons. Months Unemployed Number Unemployed 1 1029 2 1686 3 2269 4 2675 5 3487 6 4652 7 4145 8 3587 9 2325 10 1120 Let x be a random variable indicating the number of months a person is unemployed. a. Use the data to develop an empirical discrete probability distribution for x (to 4 decimals). (x) f(x) 1 2 3 4 5 6 7 8 9 10 b. Show that your probability distribution satisfies the conditions for a valid discrete probability distribution. The input in the box below will not be graded, but may be reviewed and considered by your instructor. blank c. What is the probability that a…arrow_forwardWest Virginia has one of the highest divorce rates in the nation, with an annual rate of approximately 5 divorces per 1000 people (Centers for Disease Control and Prevention website, January 12, 2012). The Marital Counseling Center, Inc. (MCC) thinks that the high divorce rate in the state may require them to hire additional staff. Working with a consultant, the management of MCC has developed the following probability distribution for x = the number of new clients for marriage counseling for the next year. Excel File: data05-19.xls x 10 f(x) .05 20 30 .10 .10 40 .20 50 60 .35 .20 a. Is this probability distribution valid? - Select your answer- Explain. f(x) Σf(x) Select your answer Select your answer b. What is the probability MCC will obtain more than 30 new clients (to 2 decimals)? c. What is the probability MCC will obtain fewer than 20 new clients (to 2 decimals)? d. Compute the expected value and variance of x. Expected value Variance clients per year squared clients per yeararrow_forward
- For unemployed persons in the United States, the average number of months of unemployment at the end of December 2009 was approximately seven months (Bureau of Labor Statistics, January 2010). Suppose the following data are for a particular region in upstate New York. The values in the first column show the number of months unemployed and the values in the second column show the corresponding number of unemployed persons. Months Unemployed Number Unemployed 1 1029 2 1686 3 2269 4 2675 5 3487 6 4652 7 4145 8 3587 9 2325 10 1120 Let x be a random variable indicating the number of months a person is unemployed. a. Use the data to develop an empirical discrete probability distribution for x (to 4 decimals). (x) f(x) 1 2 3 4 5 6 7 8 9 10 b. Show that your probability distribution satisfies the conditions for a valid discrete probability distribution. The input in the box below will not be graded, but may be reviewed and considered by your instructor. c. What is the probability that a person…arrow_forwardIn Gallup's Annual Consumption Habits Poll, telephone interviews were conducted for a random sample of 1014 adults aged 18 and over. One of the questions was "How many cups of coffee, if any, do you drink on an average day?" The following table shows the results obtained (Gallup website, August 6, 2012). Excel File: data05-23.xls Number of Cups per Day Number of Responses 0 365 264 193 3 4 or more 91 101 Define a random variable x = number of cups of coffee consumed on an average day. Let x = 4 represent four or more cups. Round your answers to four decimal places. a. Develop a probability distribution for x. x 0 1 2 3 4 f(x) b. Compute the expected value of x. cups of coffee c. Compute the variance of x. cups of coffee squared d. Suppose we are only interested in adults that drink at least one cup of coffee on an average day. For this group, let y = the number of cups of coffee consumed on an average day. Compute the expected value of y. Compare it to the expected value of x. The…arrow_forwardIn Gallup's Annual Consumption Habits Poll, telephone interviews were conducted for a random sample of 1014 adults aged 18 and over. One of the questions was "How many cups of coffee, if any, do you drink on an average day?" The following table shows the results obtained (Gallup website, August 6, 2012). Excel File: data05-23.xls Number of Cups per Day Number of Responses 0 365 264 193 2 3 4 or more 91 101 Define a random variable x = number of cups of coffee consumed on an average day. Let x = 4 represent four or more cups. Round your answers to four decimal places. a. Develop a probability distribution for x. x 0 1 2 3 f(x) b. Compute the expected value of x. cups of coffee c. Compute the variance of x. cups of coffee squared d. Suppose we are only interested in adults that drink at least one cup of coffee on an average day. For this group, let y = the number of cups of coffee consumed on an average day. Compute the expected value of y. Compare it to the expected value of x. The…arrow_forward
- A technician services mailing machines at companies in the Phoenix area. Depending on the type of malfunction, the service call can take 1, 2, 3, or 4 hours. The different types of malfunctions occur at about the same frequency. Develop a probability distribution for the duration of a service call. Duration of Call x f(x) 1 2 3 4 Which of the following probability distribution graphs accurately represents the data set? Consider the required conditions for a discrete probability function, shown below.Does this probability distribution satisfy equation (5.1)?Does this probability distribution satisfy equation (5.2)? What is the probability a service call will take three hours? A service call has just come in, but the type of malfunction is unknown. It is 3:00 P.M. and service technicians usually get off at 5:00 P.M. What is the probability the service technician will have to work overtime to fix the machine today?arrow_forwardA psychologist determined that the number of sessions required to obtain the trust of a new patient is either 1, 2, or 3. Let x be a random variable indicating the number of sessions required to gain the patient's trust. The following probability function has been proposed. x f(x) for x = 1, 2, or 3 a. Consider the required conditions for a discrete probability function, shown below. f(x) ≥0 Σf(x) = 1 (5.1) (5.2) Does this probability distribution satisfy equation (5.1)? Select Does this probability distribution satisfy equation (5.2)? Select b. What is the probability that it takes exactly 2 sessions to gain the patient's trust (to 3 decimals)? c. What is the probability that it takes at least 2 sessions to gain the patient's trust (to 3 decimals)?arrow_forwardA technician services mailing machines at companies in the Phoenix area. Depending on the type of malfunction, the service call can take 1, 2, 3, or 4 hours. The different types of malfunctions occur at about the same frequency. Develop a probability distribution for the duration of a service call. Which of the following probability distribution graphs accurately represents the data set? Consider the required conditions for a discrete probability function, shown below.Does this probability distribution satisfy equation (5.1)?Does this probability distribution satisfy equation (5.2)? What is the probability a service call will take three hours? A service call has just come in, but the type of malfunction is unknown. It is 3:00 P.M. and service technicians usually get off at 5:00 P.M. What is the probability the service technician will have to work overtime to fix the machine today?arrow_forward
 Big Ideas Math A Bridge To Success Algebra 1: Stu...AlgebraISBN:9781680331141Author:HOUGHTON MIFFLIN HARCOURTPublisher:Houghton Mifflin Harcourt
 Linear Algebra: A Modern IntroductionAlgebraISBN:9781285463247Author:David PoolePublisher:Cengage Learning
 Glencoe Algebra 1, Student Edition, 9780079039897...AlgebraISBN:9780079039897Author:CarterPublisher:McGraw Hill